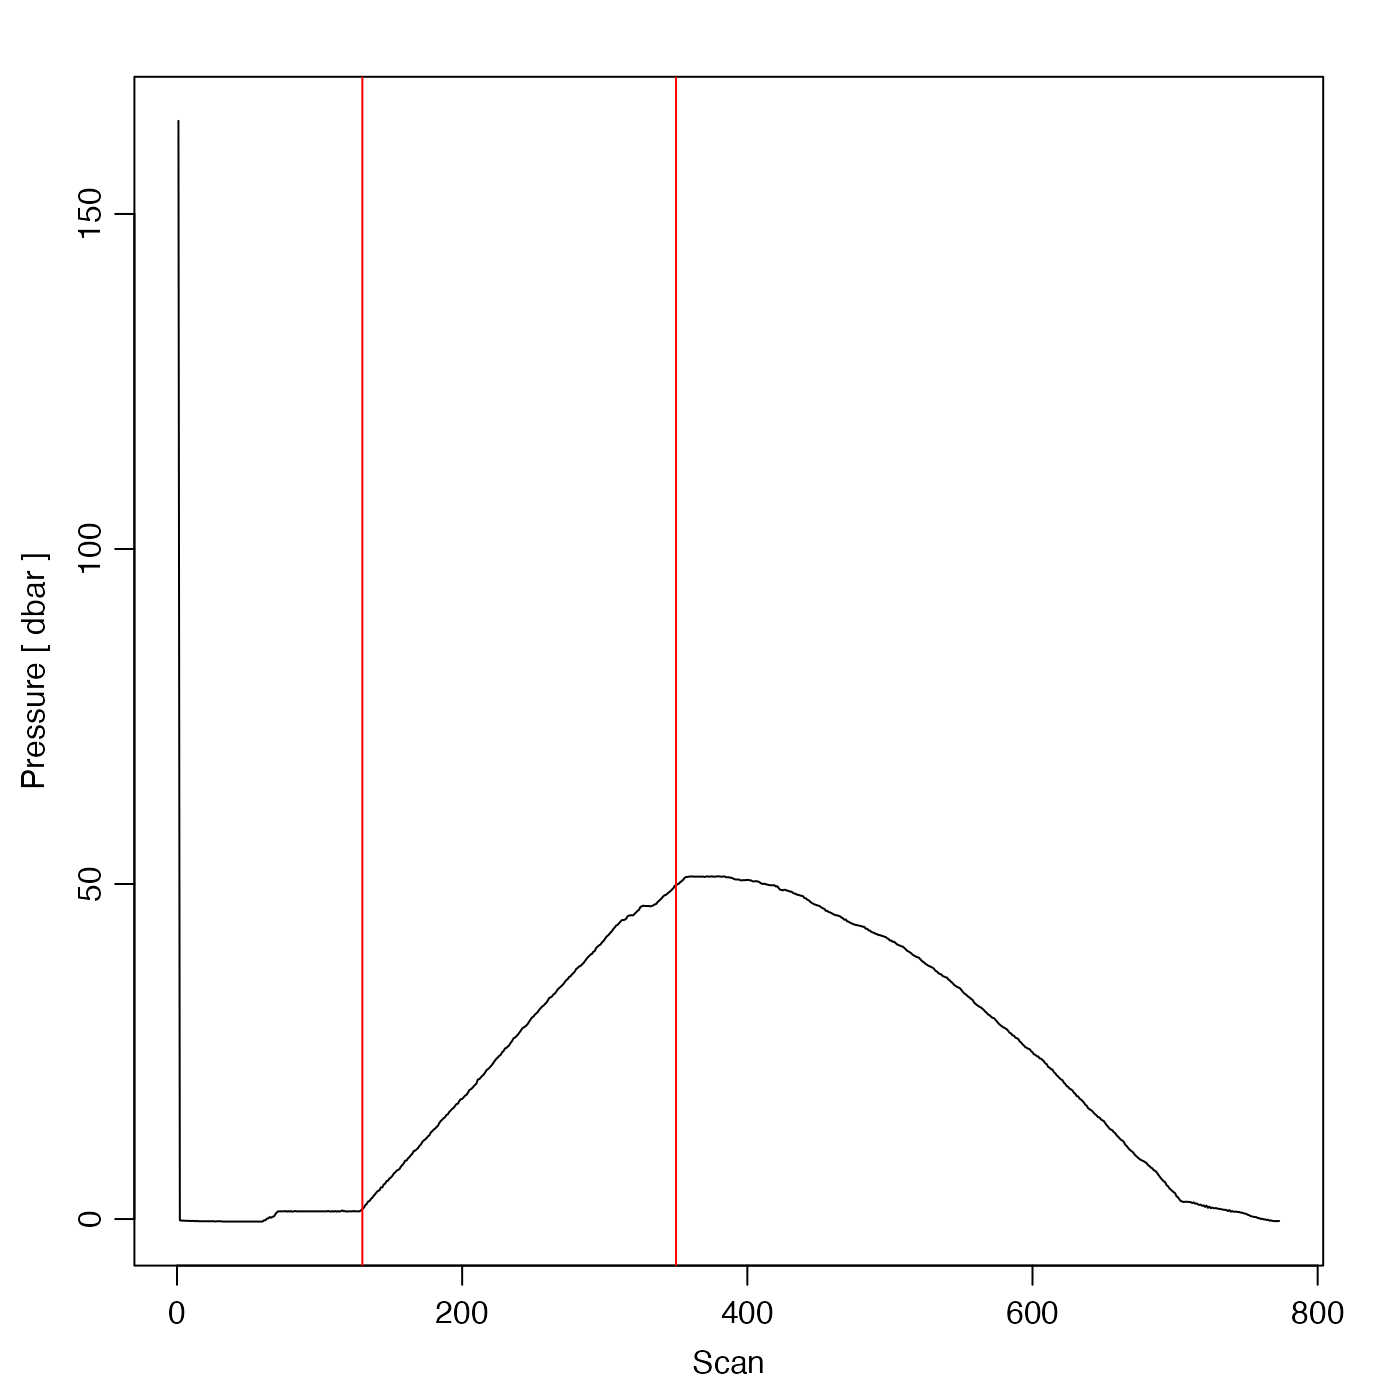
Plot CTD data as time-series against scan number, to help with trimming extraneous data from a CTD cast.
Arguments
- x
a ctd object.
- which
integer specifying the plot to be drawn: 1 for pressure vs 'x', 2 for
diff(pressure)vs 'x', 3 for temperature vs 'x', and 4 for salinity vs 'x' Here, the value of 'x' is determined byxtype.- xtype
Character string indicating variable for the x axis. The permitted values are
"scan"(the default),"time"and"index". The last of these is created by usingseq_along()on the pressure column (which is assumed to be present in any ctd object). Onlyxtype="index"is guaranteed to work for all objects, and indeed that value is used, if either"scan"or"time"is requested, but unavailable.- flipy
Logical value, ignored unless
whichis 1. IfflipyisTRUE, then a pressure plot will have high pressures at the bottom of the axis.- type
Character indicating the line type, as for
plot.default(). The default is"l", meaning to connect data with line segments. Another good choice is"o", to add points at the data.- mgp
Three-element numerical vector to use for par
(mgp), and also for par(mar), computed from this. The default is tighter than the R default, in order to use more space for the data and less for the axes.- xlim
Limits on the x value. The default,
NULL, is to select this from the data.- ylim
Limits on the y value. The default,
NULL, is to select this from the data.- mar
Four-element vector be used with par
("mar"). If set toNULL, then par("mar")is used. A good choice for a TS diagram with a palette to the right ismar=par("mar")+c(0, 0, 0, 1)).- ...
Optional arguments passed to plotting functions.
- debug
an integer specifying whether debugging information is to be printed during the processing. This is a general parameter that is used by many
ocefunctions. Generally, settingdebug=0turns off the printing, while higher values suggest that more information be printed. If one function calls another, it usually reduces the value ofdebugfirst, so that a user can often obtain deeper debugging by specifying higherdebugvalues.
Historical Note
On 2022-12-07, xtype was expanded to include "index", and
an undocumented multi-panel feature was removed.
See also
Other functions that plot oce data:
plot,adp-method,
plot,adv-method,
plot,amsr-method,
plot,argo-method,
plot,bremen-method,
plot,cm-method,
plot,coastline-method,
plot,ctd-method,
plot,gps-method,
plot,ladp-method,
plot,landsat-method,
plot,lisst-method,
plot,lobo-method,
plot,met-method,
plot,odf-method,
plot,rsk-method,
plot,satellite-method,
plot,sealevel-method,
plot,section-method,
plot,tidem-method,
plot,topo-method,
plot,windrose-method,
plot,xbt-method,
plotProfile(),
plotTS()
Other things related to ctd data:
CTD_BCD2014666_008_1_DN.ODF.gz,
[[,ctd-method,
[[<-,ctd-method,
argo2ctd(),
as.ctd(),
cnvName2oceName(),
ctd,
ctd-class,
ctd.cnv.gz,
ctdDecimate(),
ctdFindProfiles(),
ctdFindProfilesRBR(),
ctdRaw,
ctdRepair(),
ctdTrim(),
ctd_aml_type1.csv.gz,
ctd_aml_type3.csv.gz,
d200321-001.ctd.gz,
d201211_0011.cnv.gz,
handleFlags,ctd-method,
initialize,ctd-method,
initializeFlagScheme,ctd-method,
oceNames2whpNames(),
oceUnits2whpUnits(),
plot,ctd-method,
plotProfile(),
plotTS(),
read.ctd(),
read.ctd.aml(),
read.ctd.itp(),
read.ctd.odf(),
read.ctd.odv(),
read.ctd.saiv(),
read.ctd.sbe(),
read.ctd.ssda(),
read.ctd.woce(),
read.ctd.woce.other(),
setFlags,ctd-method,
subset,ctd-method,
summary,ctd-method,
woceNames2oceNames(),
woceUnit2oceUnit(),
write.ctd()