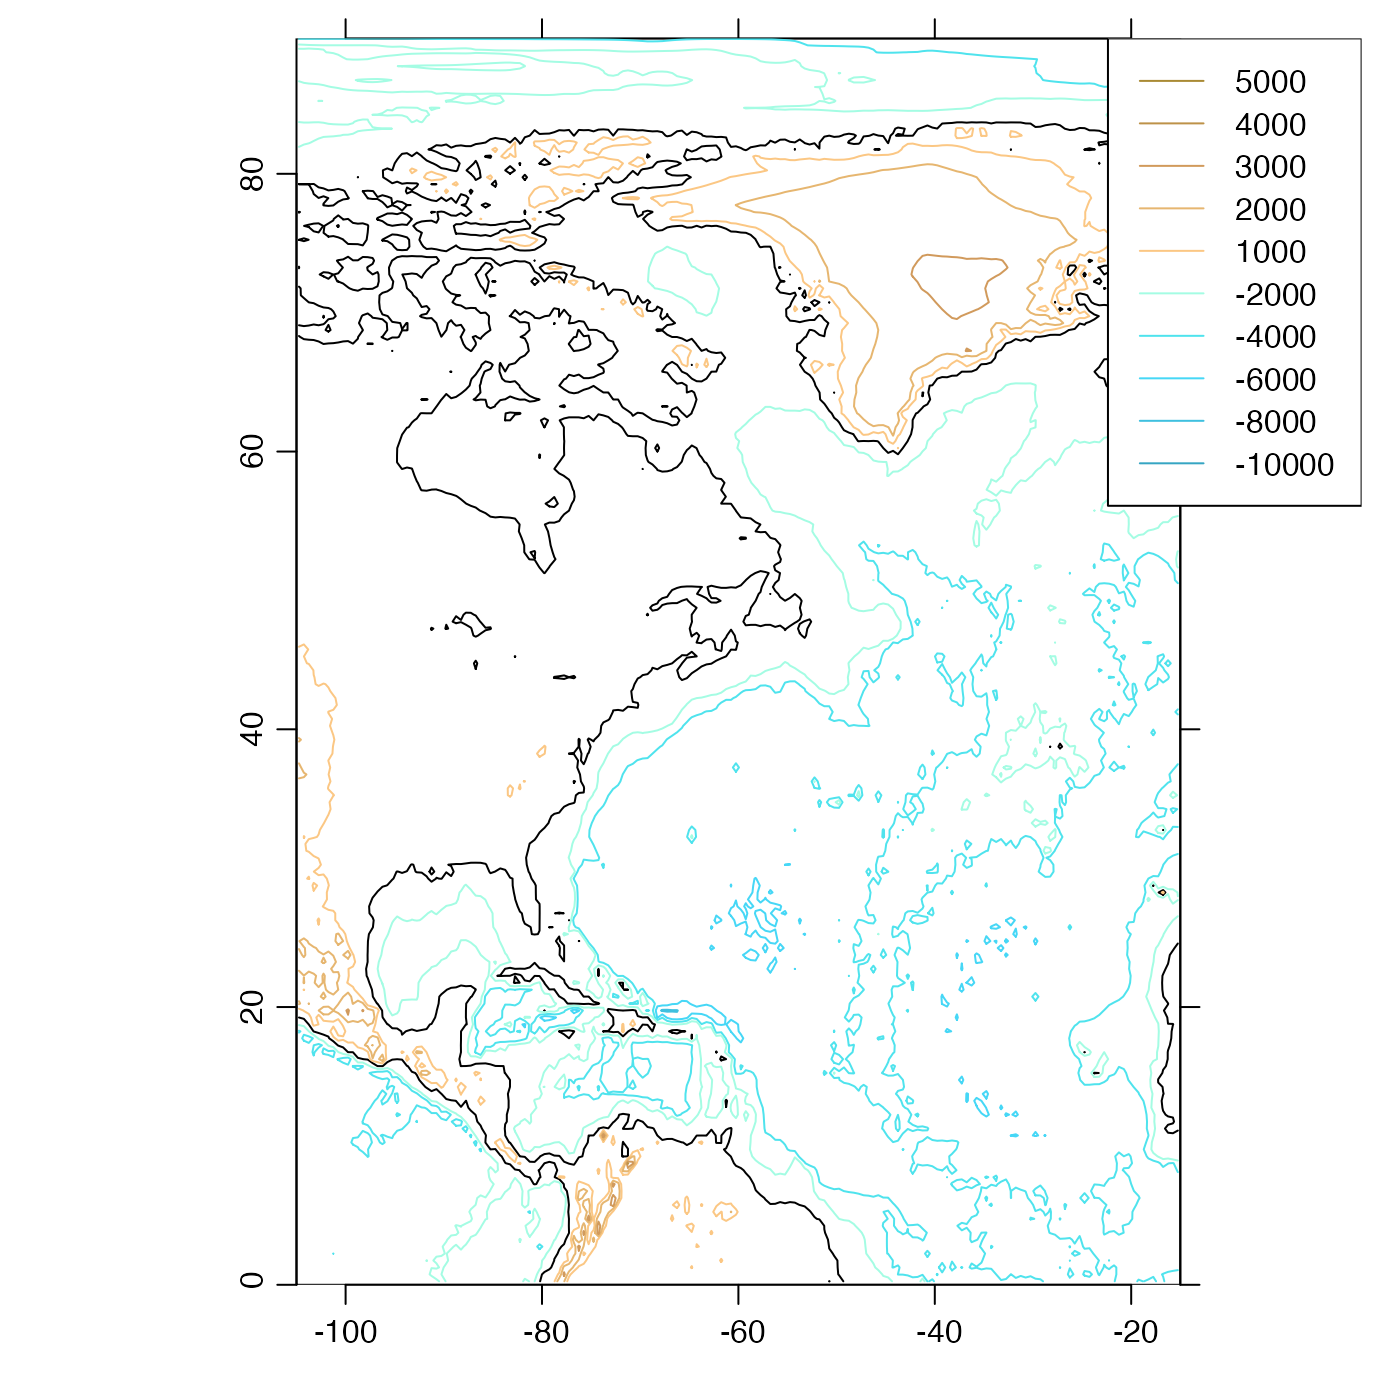
This plots contours of topographic elevation. The plot aspect ratio is set
based on the middle latitude in the plot. The line properties, such as
land.lwd, may either be a single item, or a vector; in the latter case,
the length must match the length of the corresponding properties, e.g.
land.z.
Usage
# S4 method for class 'topo'
plot(
  x,
  xlab = "",
  ylab = "",
  asp,
  clongitude,
  clatitude,
  span,
  expand = 1.5,
  water.z,
  col.water,
  lty.water,
  lwd.water,
  land.z,
  col.land,
  lty.land,
  lwd.land,
  geographical = FALSE,
  location = "topright",
  mgp = getOption("oceMgp"),
  mar = c(mgp[1] + 1, mgp[1] + 1, 1, 1),
  debug = getOption("oceDebug"),
  ...
)
Arguments
- x
a topo object.
- xlab, ylab
Character strings giving a label for the x and y axes.
- asp
Aspect ratio for plot. The default is for
plot.coastlineto set the aspect ratio to give natural latitude-longitude scaling somewhere near the centre latitude on the plot. Often, it makes sense to setaspyourself, e.g. to get correct shapes at 45N, useasp=1/cos(45*pi/180). Note that the land mass is not symmetric about the equator, so to get good world views you should setasp=1or setylimto be symmetric about zero. Any given value ofaspis ignored, ifclongitudeandclatitudeare given.- clongitude
Optional center longitude of map, in degrees east; see
clatitude.- clatitude
Optional center latitude of map, in degrees north. If this and
clongitudeare provided, then any provided value ofaspis ignored, and instead the plot aspect ratio is computed based on the center latitude. Also, ifclongitudeandclatitudeare provided, thenspanmust be, also.- span
Optional suggested span of plot, in kilometers (must be supplied, if
clongitudeandclatitudeare supplied).- expand
Numerical factor for the expansion of plot limits, showing area outside the plot, e.g. if showing a ship track as a coastline, and then an actual coastline to show the ocean boundary. The value of
expandis ignored if eitherxlimorylimis given.- water.z
Depths at which to plot water contours. If not provided, these are inferred from the data.
- col.water
Colors corresponding to
water.zvalues. If not provided, these will be"fill"colors fromoce.colorsGebco().- lty.water
Line type(s) for water contours.
- lwd.water
Line width(s) for water contours.
- land.z
Depths at which to plot land contours. If not provided, these are inferred from the data. If set to
NULL, no land contours will be plotted.- col.land
Colors corresponding to
land.zvalues. If not provided, these will be"fill"colors fromoce.colorsGebco().- lty.land
Line type(s) for land contours.
- lwd.land
Line width(s) for land contours.
- geographical
Logical, indicating whether to plot latitudes and longitudes without minus signs.
- location
Location for a legend (or
"none", for no legend).- mgp
3-element numerical vector to use for
par(mgp), and also forpar(mar), computed from this. The default is tighter than the R default, in order to use more space for the data and less for the axes.- mar
Four-element numerical vector to be used with
par("mar").- debug
Numerical value, with positive values indicating higher levels of debugging.
- ...
Additional arguments passed on to plotting functions.
See also
Other functions that plot oce data:
plot,adp-method,
plot,adv-method,
plot,amsr-method,
plot,argo-method,
plot,bremen-method,
plot,cm-method,
plot,coastline-method,
plot,ctd-method,
plot,gps-method,
plot,ladp-method,
plot,landsat-method,
plot,lisst-method,
plot,lobo-method,
plot,met-method,
plot,odf-method,
plot,rsk-method,
plot,satellite-method,
plot,sealevel-method,
plot,section-method,
plot,tidem-method,
plot,windrose-method,
plot,xbt-method,
plotProfile(),
plotScan(),
plotTS()
Other things related to topo data:
[[,topo-method,
[[<-,topo-method,
as.topo(),
download.topo(),
read.topo(),
subset,topo-method,
summary,topo-method,
topo-class,
topoInterpolate(),
topoWorld