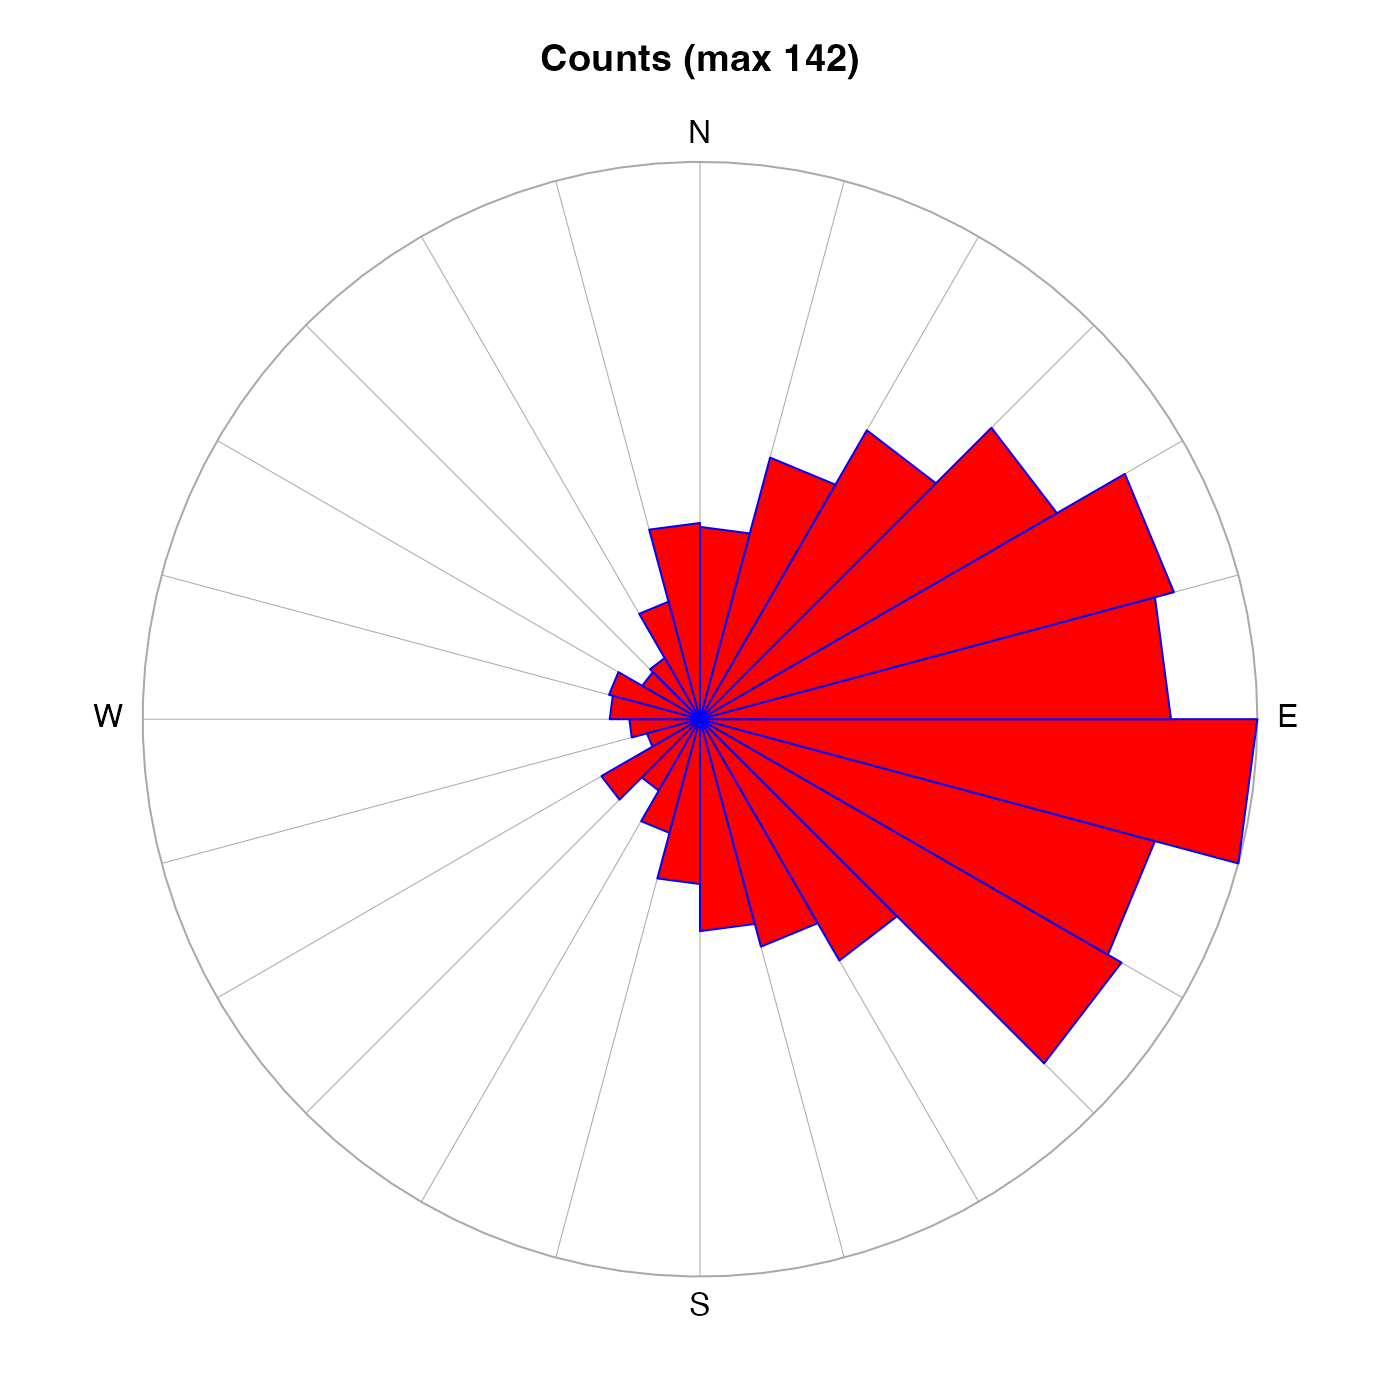
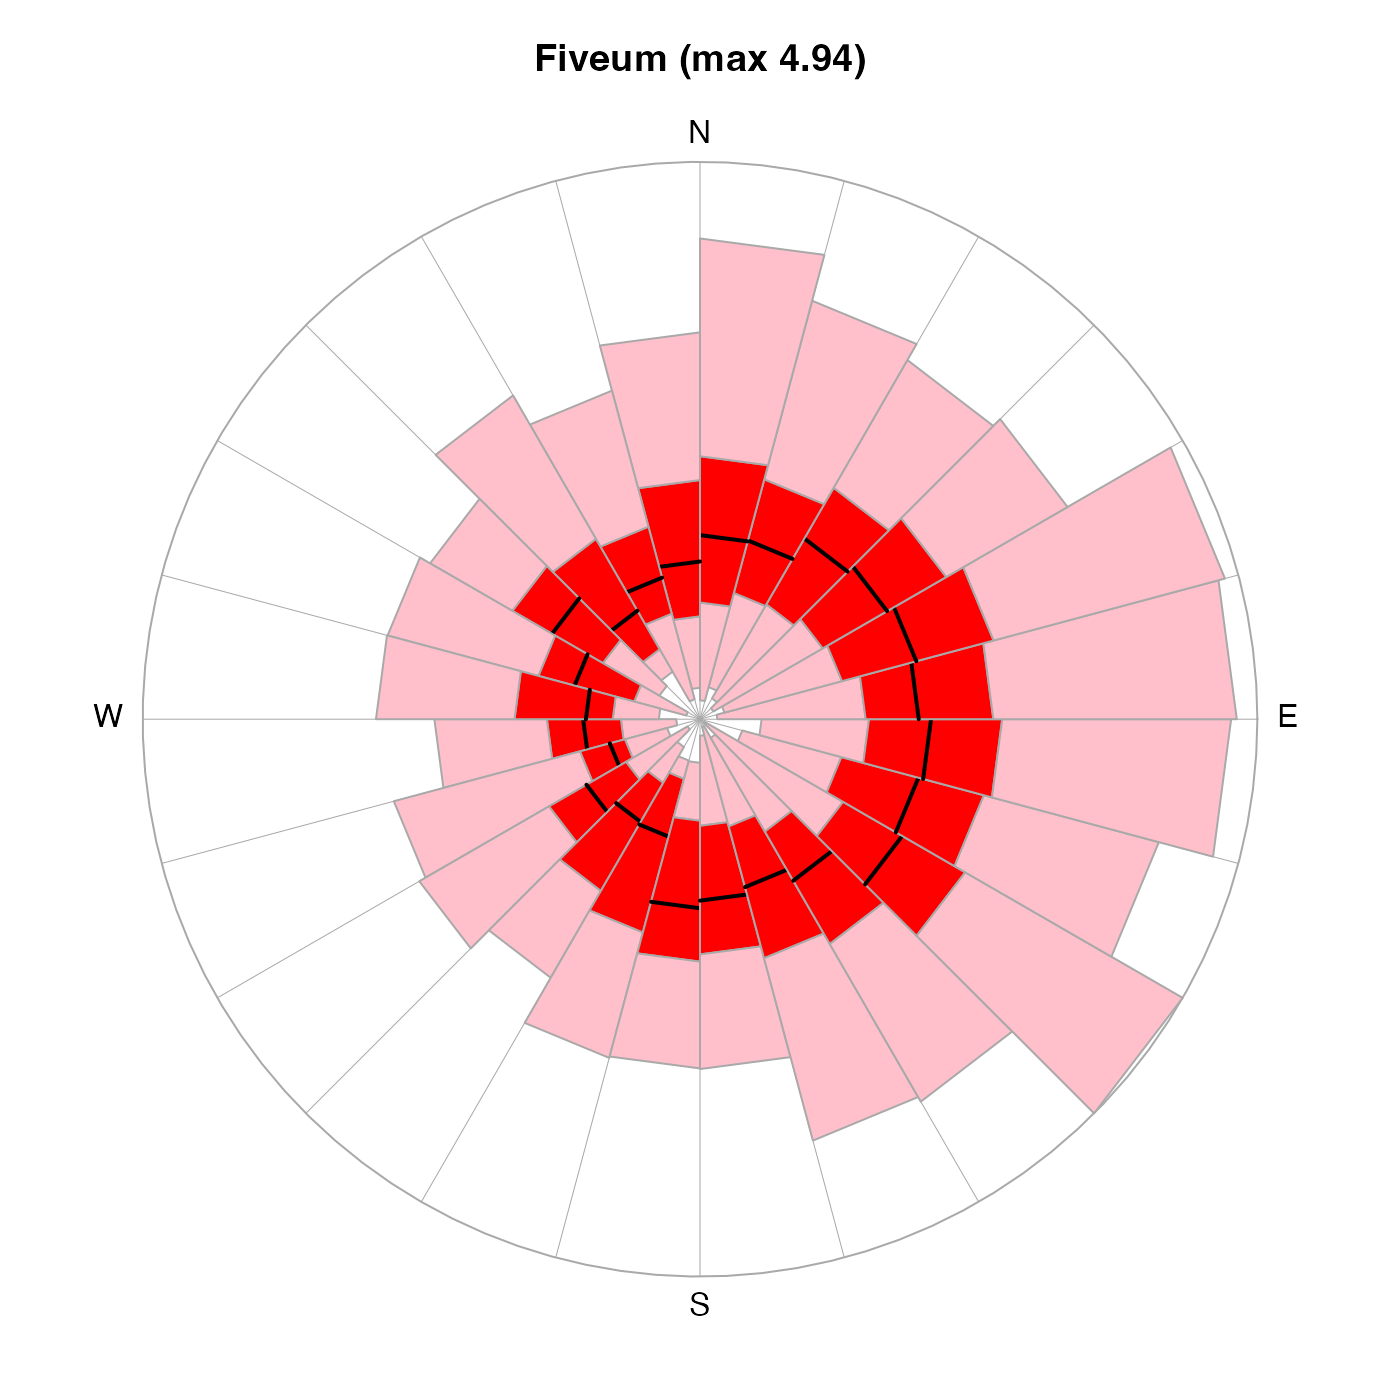
Plot a windrose object.
Arguments
- x
a windrose object.
- type
The thing to be plotted, either the number of counts in the angle interval, the mean of the values in the interval, the median of the values, or a
fivenum()representation of the values.- convention
String indicating whether to use meteorological convention or oceanographic convention for the arrows that emanate from the centre of the rose. In meteorological convection, an arrow emanates towards the right on the diagram if the wind is from the east; in oceanographic convention, such an arrow indicates flow to the east.
- mgp
Three-element numerical vector to use for
par(mgp), and also forpar(mar), computed from this. The default is tighter than the R default, in order to use more space for the data and less for the axes.- mar
Four-element numerical vector to be used with
par("mar").- col
Optional list of colors to use. If not set, the colors will be
c("red", "pink", "blue", "lightgray"). For the first three types of plot, the first color in this list is used to fill in the rose, the third is used for the petals of the rose, and the fourth is used for grid lines. For the"fivenum"type, the region from the lower hinge to the first quartile is coloured pink, the region from the first quartile to the third quartile is coloured red, and the region from the third quartile to the upper hinge is coloured pink. Then the median is drawn in black.- debug
an integer specifying whether debugging information is to be printed during the processing. This is a general parameter that is used by many
ocefunctions. Generally, settingdebug=0turns off the printing, while higher values suggest that more information be printed. If one function calls another, it usually reduces the value ofdebugfirst, so that a user can often obtain deeper debugging by specifying higherdebugvalues.
See also
Other functions that plot oce data:
plot,adp-method,
plot,adv-method,
plot,amsr-method,
plot,argo-method,
plot,bremen-method,
plot,cm-method,
plot,coastline-method,
plot,ctd-method,
plot,gps-method,
plot,ladp-method,
plot,landsat-method,
plot,lisst-method,
plot,lobo-method,
plot,met-method,
plot,odf-method,
plot,rsk-method,
plot,satellite-method,
plot,sealevel-method,
plot,section-method,
plot,tidem-method,
plot,topo-method,
plot,xbt-method,
plotProfile(),
plotScan(),
plotTS()
Other things related to windrose data:
[[,windrose-method,
[[<-,windrose-method,
as.windrose(),
summary,windrose-method,
windrose-class

