Creates a multi-panel summary plot of data measured in a meteorological data
set. cast. The panels are controlled by the which argument.
Arguments
- x
a met object.
- which
list of desired plot types.
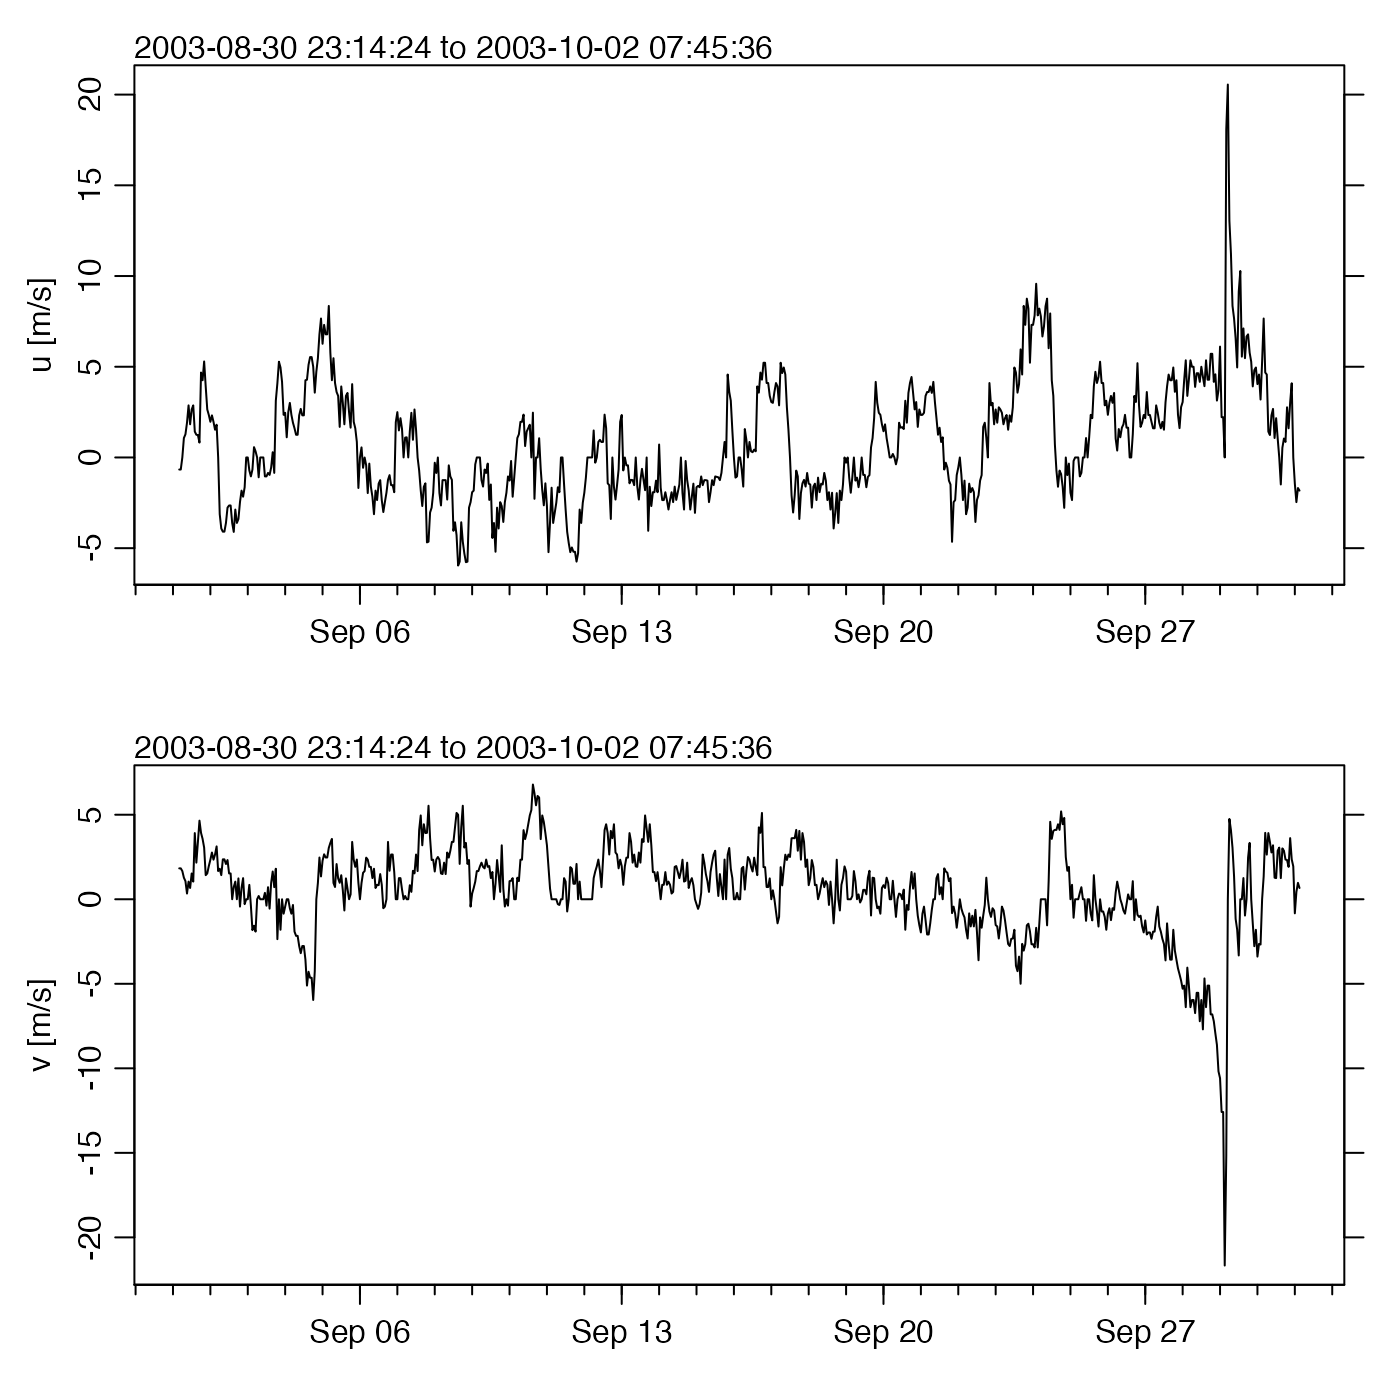
which=1gives a time-series plot of temperaturewhich=2gives a time-series plot of pressurewhich=3gives a time-series plot of the x (eastward) component of velocitywhich=4gives a time-series plot of the y (northward) component of velocitywhich=5gives a time-series plot of speedwhich=6gives a time-series plot of direction (degrees clockwise from north; note that the values returned bymet[["direction"]]must be multiplied by 10 to get the direction plotted)
- mgp
A 3-element numerical vector used with
par("mgp")to control the spacing of axis elements. The default is tighter than the R default.- mar
A 4-element numerical vector used with
par("mar")to control the plot margins. The default is tighter than the R default.- tformat
optional argument passed to
oce.plot.ts(), for plot types that call that function. (Seestrptime()for the format used.)- debug
an integer specifying whether debugging information is to be printed during the processing. This is a general parameter that is used by many
ocefunctions. Generally, settingdebug=0turns off the printing, while higher values suggest that more information be printed. If one function calls another, it usually reduces the value ofdebugfirst, so that a user can often obtain deeper debugging by specifying higherdebugvalues.
Details
If more than one panel is drawn, then on exit from plot.met, the
value of par will be reset to the value it had before the function
call. However, if only one panel is drawn, the adjustments to par
made within plot.met are left in place, so that further additions may
be made to the plot.
See also
Other functions that plot oce data:
plot,adp-method,
plot,adv-method,
plot,amsr-method,
plot,argo-method,
plot,bremen-method,
plot,cm-method,
plot,coastline-method,
plot,ctd-method,
plot,gps-method,
plot,ladp-method,
plot,landsat-method,
plot,lisst-method,
plot,lobo-method,
plot,odf-method,
plot,rsk-method,
plot,satellite-method,
plot,sealevel-method,
plot,section-method,
plot,tidem-method,
plot,topo-method,
plot,windrose-method,
plot,xbt-method,
plotProfile(),
plotScan(),
plotTS()
Other things related to met data:
[[,met-method,
[[<-,met-method,
as.met(),
download.met(),
met,
met-class,
read.met(),
subset,met-method,
summary,met-method
Examples
library(oce)
data(met)
plot(met, which = 3:4)


# Wind speed and direction during Hurricane Juan
# Compare with the final figure in a white paper by Chris Fogarty
# (available at http://www.novaweather.net/Hurricane_Juan_files/McNabs_plot.pdf
# downloaded 2017-01-02).
library(oce)
data(met)
t0 <- as.POSIXct("2003-09-29 04:00:00", tz = "UTC")
dt <- 12 * 3600
juan <- subset(met, t0 - dt <= time & time <= t0 + dt)
par(mfrow = c(2, 1))
plot(juan, which = 5)
abline(v = t0)
plot(juan, which = 6)
abline(v = t0)
