This function plots a coastline. An attempt is made to fill the space of the plot, and this is done by limiting either the longitude range or the latitude range, as appropriate, by modifying the eastern or northern limit, as appropriate.
Usage
# S4 method for class 'coastline'
plot(
  x,
  xlab = "",
  ylab = "",
  showHemi = TRUE,
  asp,
  clongitude,
  clatitude,
  span,
  lonlabels = TRUE,
  latlabels = TRUE,
  projection = NULL,
  expand = 1,
  mgp = getOption("oceMgp"),
  mar = c(mgp[1] + 1, mgp[1] + 1, 1, 1),
  bg,
  fill,
  type = "polygon",
  border = NULL,
  col = NULL,
  axes = TRUE,
  cex.axis = par("cex.axis"),
  add = FALSE,
  inset = FALSE,
  geographical = 0,
  longitudelim,
  latitudelim,
  debug = getOption("oceDebug"),
  ...
)
Arguments
- x
a coastline object.
- xlab
label for x axis
- ylab
label for y axis
- showHemi
logical indicating whether to show the hemisphere in axis tick labels.
- asp
Aspect ratio for plot. The default is for
plot,coastline-methodto set the aspect ratio to give natural latitude-longitude scaling somewhere near the centre latitude on the plot. Often, it makes sense to setaspyourself, e.g. to get correct shapes at 45N, useasp=1/cos(45*pi/180). Note that the land mass is not symmetric about the equator, so to get good world views you should setasp=1or setylimto be symmetric about zero. Any given value ofaspis ignored, ifclongitudeandclatitudeare given (or if the latter two are inferred fromprojection.- clongitude, clatitude
optional center latitude of map, in decimal degrees. If both
clongitudeandclatitudeare provided, or alternatively if they can be inferred from substrings+lon_0and+lat_0inprojection, then any provided value ofaspis ignored, and instead the plot aspect ratio is computed based on the center latitude. Ifclongitudeandclatitudeare known, thenspanmust also be provided, and in this case, it is not permitted to also specifylongitudelimandlatitudelim.- span
optional suggested diagonal span of the plot, in kilometers. The plotted span is usually close to the suggestion, although the details depend on the plot aspect ratio and other factors, so some adjustment may be required to fine-tune a plot. A value for
spanmust be supplied, ifclongitudeandclatitudeare supplied (or inferred fromprojection).- lonlabels, latlabels
optional vectors of longitude and latitude to label on the sides of plot, passed to
mapPlot()to control axis labelling, for plots done with map projections (i.e. for cases in whichprojectionis notNULL).- projection
optional map projection to use (see the
mapPlot()argument of the same name). If set toFALSEthen no projection is used, and the data are plotted in a cartesion frame, with aspect ratio set to reduce distortion near the middle of the plot. This option is useful if the coastline produces spurious horizontal lines owing to islands crossing the plot edges (a problem that plagues map projections). Ifprojectionis not set, a Mercator projection is used for latitudes below about 70 degrees, as ifprojection="+proj=merc"had been supplied, or a Stereopolar one is used as ifprojection="+proj=stere". Otherwise,projectionmust be a character string identifying a projection accepted bymapPlot().- expand
numerical factor for the expansion of plot limits, showing area outside the plot, e.g. if showing a ship track as a coastline, and then an actual coastline to show the ocean boundary. The value of
expandis ignored if eitherxlimorylimis given.- mgp
3-element numerical vector to use for
par("mgp"), and also forpar(mar), computed from this. The default is tighter than the R default, in order to use more space for the data and less for the axes.- mar
value to be used with
par("mar").- bg
optional color to be used for the background of the map. This comes in handy for drawing insets (see “details”).
- fill
a legacy parameter that will be permitted only temporarily; see “History”.
- type
indication of type; may be
"polygon", for a filled polygon,"p"for points,"l"for line segments, or"o"for points overlain with line segments. Seecolorfor a note on how the the value oftypealters the meaning of thecolorargument.- border
color used to indicate land (if
type="polygon") or the coastline and international borders (iftype="l").- col
either the color for filling polygons (if
type="polygon") or the color of the points and line segments (iftype="p",type="l", ortype="o").- axes
boolean, set to
TRUEto plot axes.- cex.axis
value for axis font size factor.
- add
boolean, set to
TRUEto draw the coastline on an existing plot. Note that this retains the aspect ratio of that existing plot, so it is important to set that correctly, e.g. withasp=1/cos(lat * pi / 180), whereclatis the central latitude of the plot.- inset
set to
TRUEfor use withinplotInset(). The effect is to prevent the present function from adjusting margins, which is necessary because margin adjustment is the basis for the method used byplotInset().- geographical
flag indicating the style of axes. With
geographical=0, the axes are conventional, with decimal degrees as the unit, and negative signs indicating the southern and western hemispheres. Withgeographical=1, the signs are dropped, with axis values being in decreasing order within the southern and western hemispheres. Withgeographical=2, the signs are dropped and the axes are labelled with degrees, minutes and seconds, as appropriate, and hemispheres are indicated with letters. Withgeographical=3, things are the same as forgeographical=2, but the hemisphere indication is omitted. Finally, withgeographical=4, unsigned numbers are used, followed by lettersNin the northern hemisphere,Sin the southern,Ein the eastern, andWin the western.- longitudelim
this and
latitudelimprovide a second way to suggest plot ranges. Note that these may not be supplied ifclongitude,clatitudeandspanare given.- latitudelim
see
longitudelim.- debug
set to
TRUEto get debugging information during processing.- ...
optional arguments passed to plotting functions. For example, set
yaxp=c(-90,90,4)for a plot extending from pole to pole.
Details
If longitudelim, latitudelim and projection are all given,
then these arguments are passed to mapPlot() to produce the plot.
(The call uses bg for col, and uses col, fill
and border directly.) If the results need further customization,
users should use mapPlot() directly.
If projection is provided without longitudelim or latitudelim,
then mapPlot() is still called, but longitudelim and
latitudelim are computed from clongitude, clatitude and span.
If projection is not provided, much simpler plots are produced. These are
Cartesian, with aspect ratio set to minimize shape distortion at the central latitude.
Although these are crude, they have the benefit of always working, which cannot
be said of true map projections, which can be problematic in various ways owing
to difficulties in inverting projection calculations.
To get an inset map inside another map, draw the first map, do
par(new=TRUE), and then call plot,coastline-method() with a value of
mar that moves the inset plot to a desired location on the existing
plot, and with bg="white".
History
Until February, 2016, plot,coastline-method relied on a
now-defunct argument fill to control colors; col is to be
used now, instead.
See also
The documentation for the coastline class explains the structure of coastline objects, and also outlines the other functions dealing with them.
Other functions that plot oce data:
plot,adp-method,
plot,adv-method,
plot,amsr-method,
plot,argo-method,
plot,bremen-method,
plot,cm-method,
plot,ctd-method,
plot,gps-method,
plot,ladp-method,
plot,landsat-method,
plot,lisst-method,
plot,lobo-method,
plot,met-method,
plot,odf-method,
plot,rsk-method,
plot,satellite-method,
plot,sealevel-method,
plot,section-method,
plot,tidem-method,
plot,topo-method,
plot,windrose-method,
plot,xbt-method,
plotProfile(),
plotScan(),
plotTS()
Other things related to coastline data:
[[,coastline-method,
[[<-,coastline-method,
as.coastline(),
coastline-class,
coastlineBest(),
coastlineCut(),
coastlineWorld,
download.coastline(),
read.coastline.openstreetmap(),
read.coastline.shapefile(),
subset,coastline-method,
summary,coastline-method
Examples
# \donttest{
library(oce)
par(mar = c(2, 2, 1, 1))
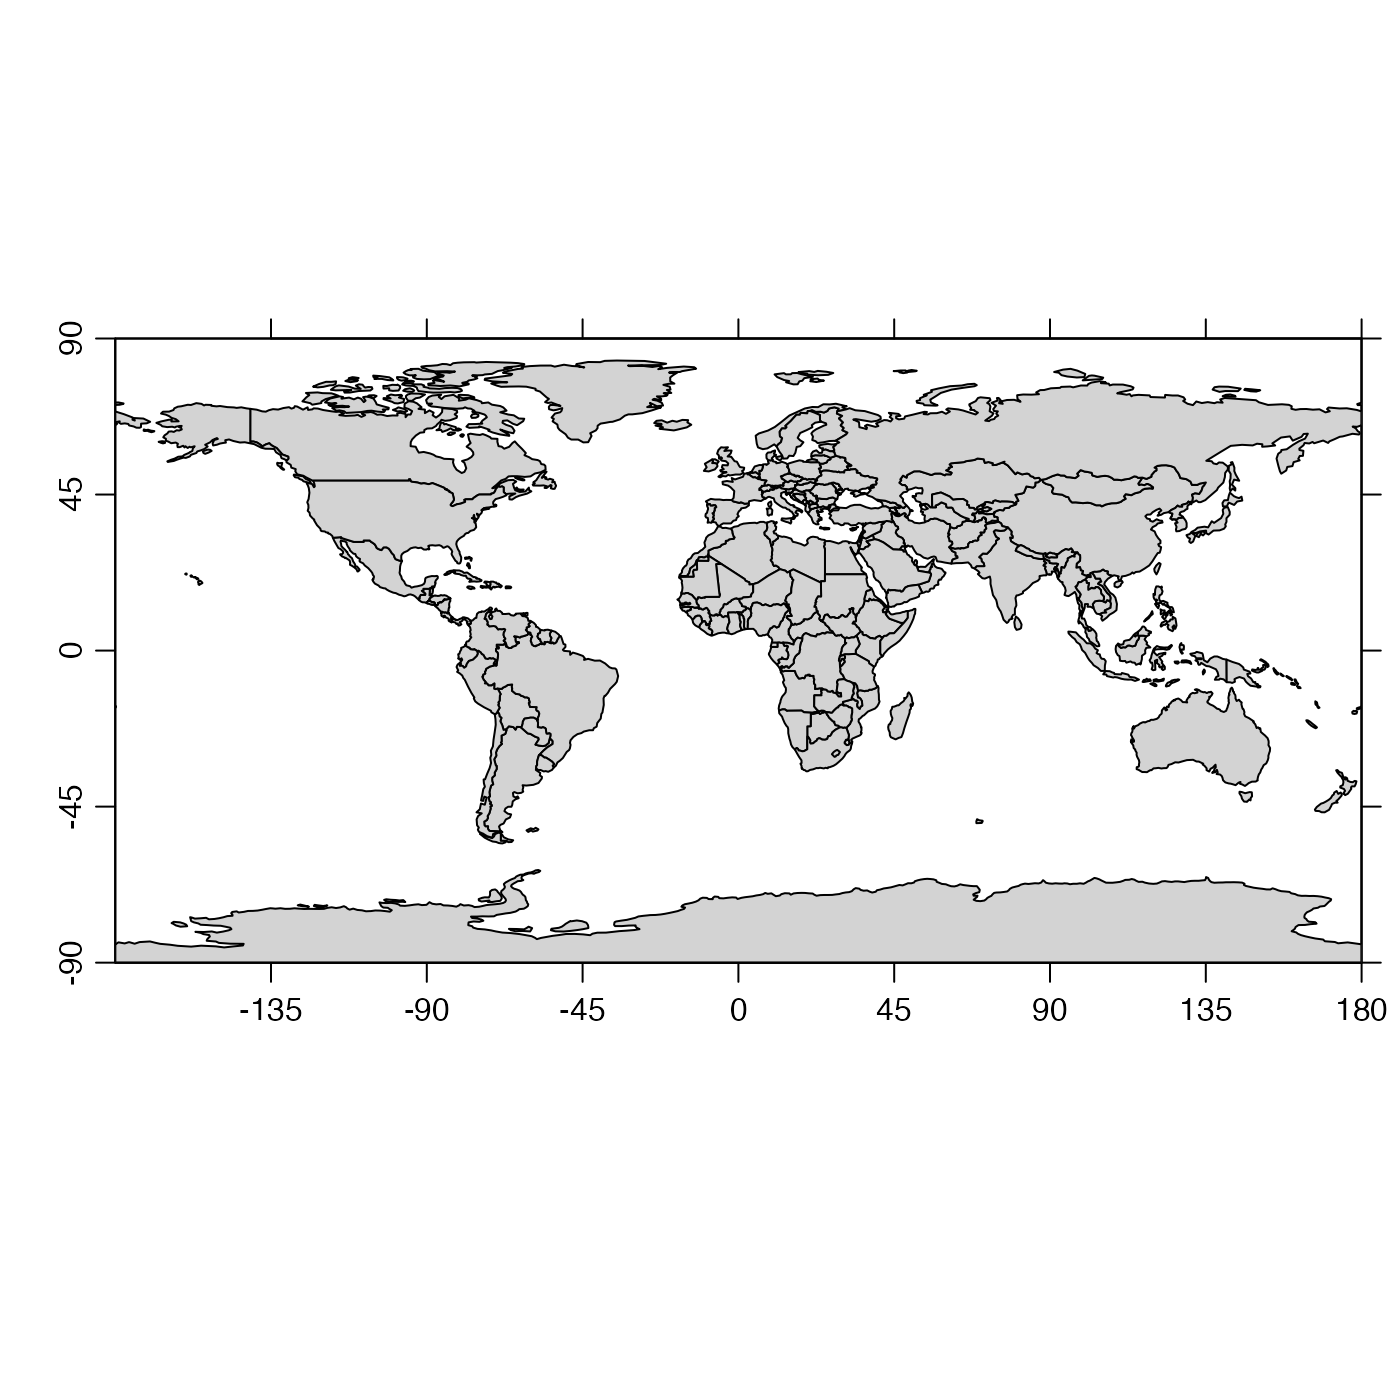
data(coastlineWorld)
plot(coastlineWorld)
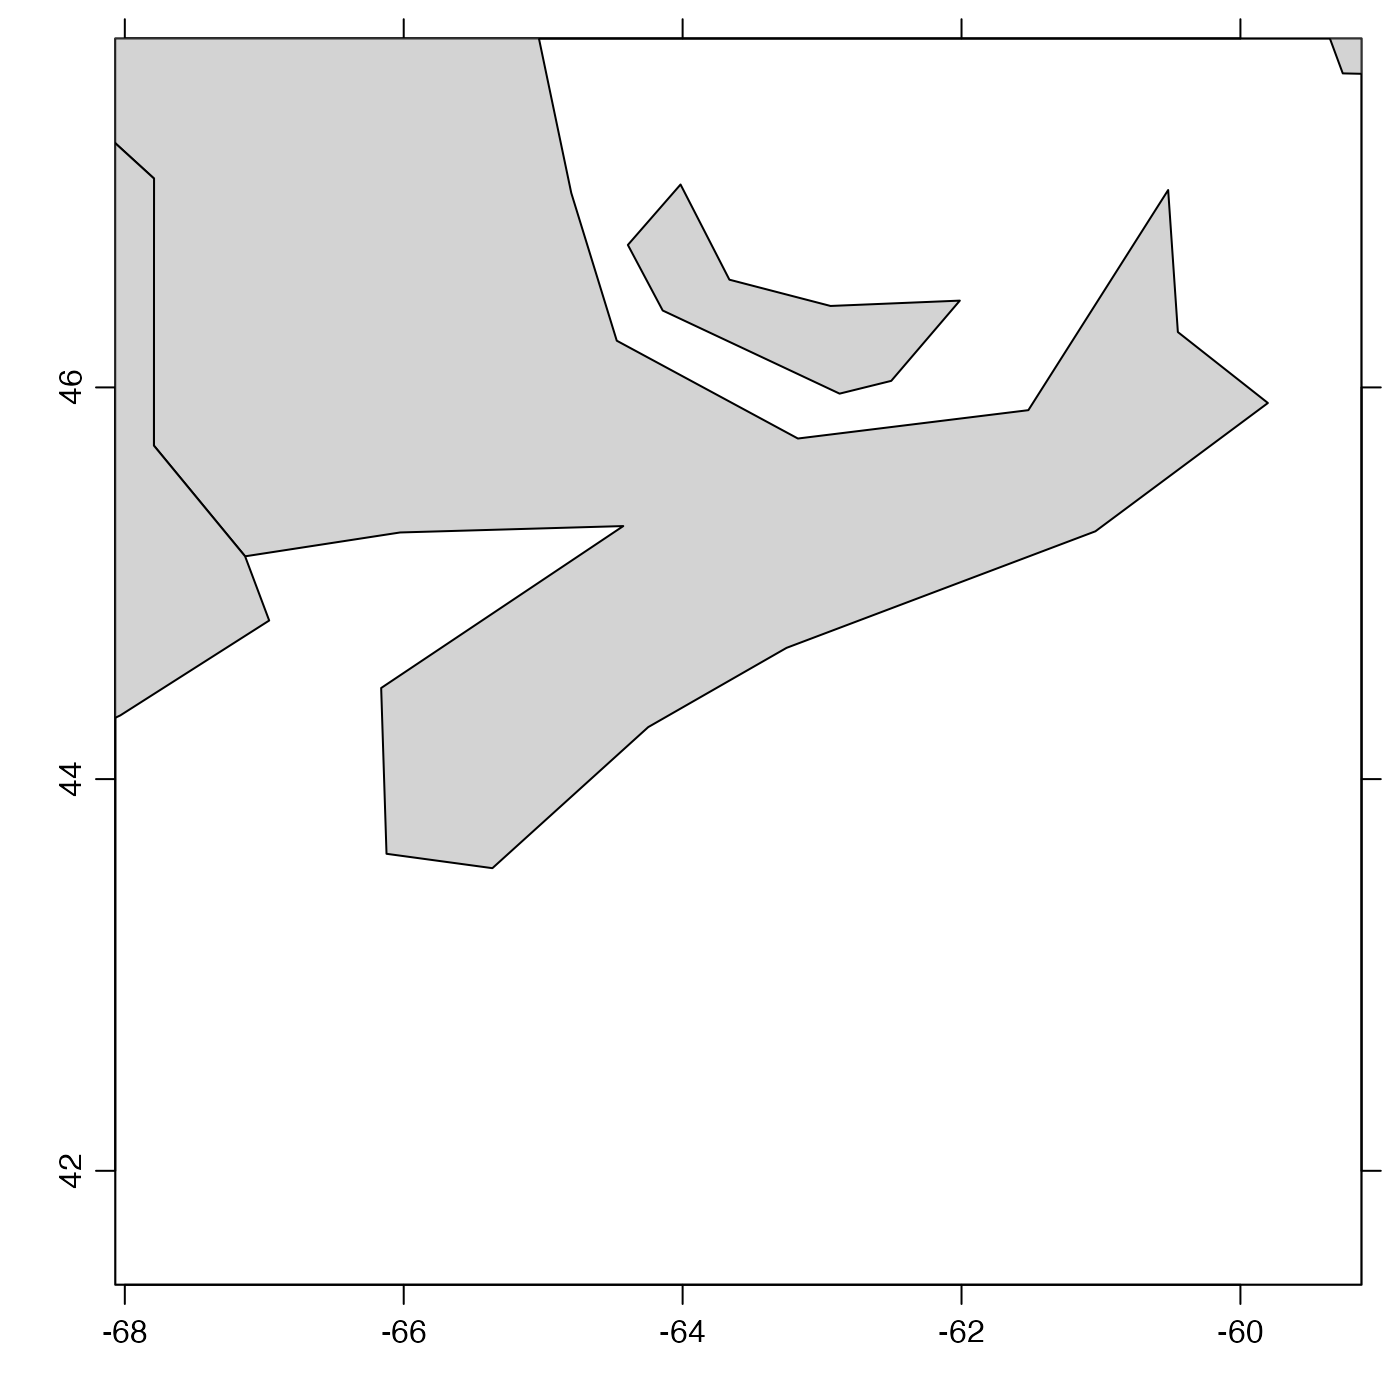
 plot(coastlineWorld, clongitude = -63.6, clatitude = 44.6, span = 1000)
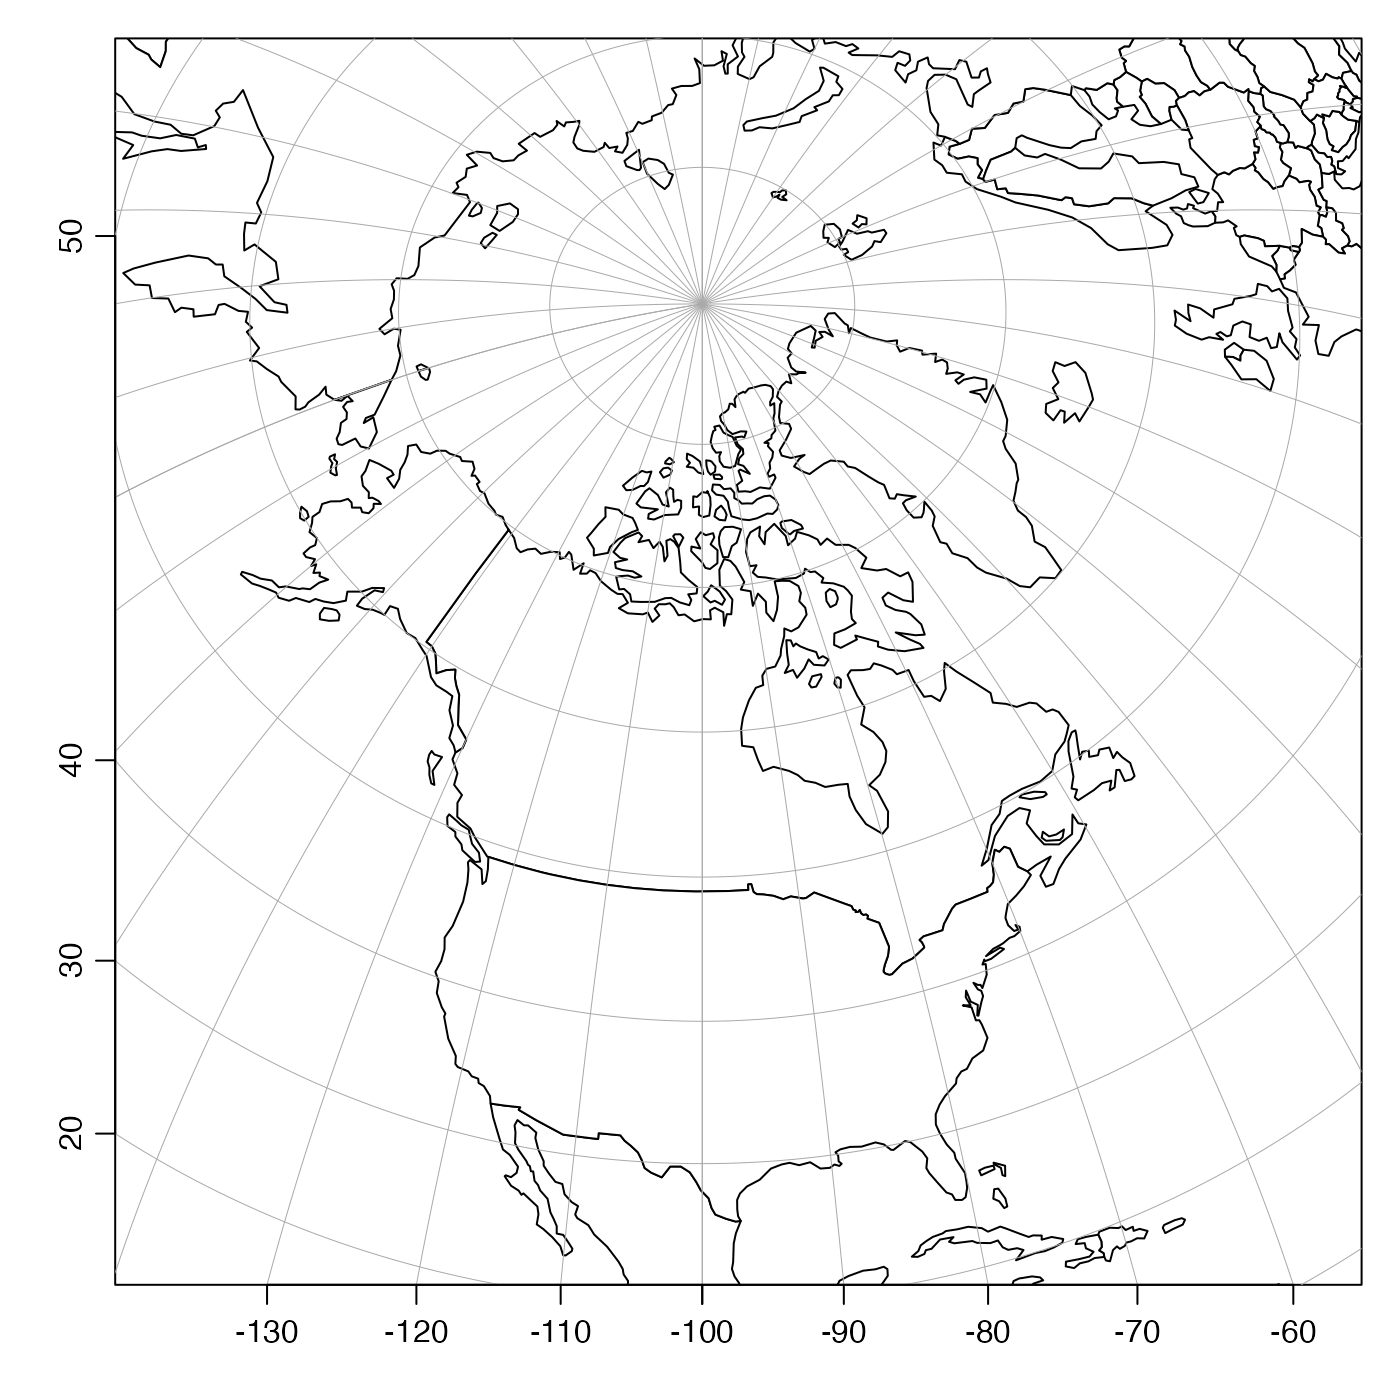
 # Canada in Lambert projection
plot(coastlineWorld,
clongitude = -95, clatitude = 65, span = 5500,
grid = 10, projection = "+proj=laea +lon_0=-100 +lat_0=55"
)
# Canada in Lambert projection
plot(coastlineWorld,
clongitude = -95, clatitude = 65, span = 5500,
grid = 10, projection = "+proj=laea +lon_0=-100 +lat_0=55"
)
 # }
# }