The location is approximately 30km southeast of Halifax Harbour, at "Station 2" of the Halifax Line on the Scotian Shelf.
See also
Other raw datasets:
D4902337_219.nc,
adp_rdi.000,
ctd.cnv.gz,
ctd_aml_type1.csv.gz,
ctd_aml_type3.csv.gz,
d200321-001.ctd.gz,
d201211_0011.cnv.gz,
xbt.edf,
xbt2.edf
Other things related to ctd data:
[[,ctd-method,
[[<-,ctd-method,
argo2ctd(),
as.ctd(),
cnvName2oceName(),
ctd,
ctd-class,
ctd.cnv.gz,
ctdDecimate(),
ctdFindProfiles(),
ctdFindProfilesRBR(),
ctdRaw,
ctdRepair(),
ctdTrim(),
ctd_aml_type1.csv.gz,
ctd_aml_type3.csv.gz,
d200321-001.ctd.gz,
d201211_0011.cnv.gz,
handleFlags,ctd-method,
initialize,ctd-method,
initializeFlagScheme,ctd-method,
oceNames2whpNames(),
oceUnits2whpUnits(),
plot,ctd-method,
plotProfile(),
plotScan(),
plotTS(),
read.ctd(),
read.ctd.aml(),
read.ctd.itp(),
read.ctd.odf(),
read.ctd.odv(),
read.ctd.saiv(),
read.ctd.sbe(),
read.ctd.ssda(),
read.ctd.woce(),
read.ctd.woce.other(),
setFlags,ctd-method,
subset,ctd-method,
summary,ctd-method,
woceNames2oceNames(),
woceUnit2oceUnit(),
write.ctd()
Other things related to odf data:
ODF2oce(),
ODFListFromHeader(),
ODFNames2oceNames(),
[[,odf-method,
[[<-,odf-method,
odf-class,
plot,odf-method,
read.ctd.odf(),
read.odf(),
subset,odf-method,
summary,odf-method
Examples
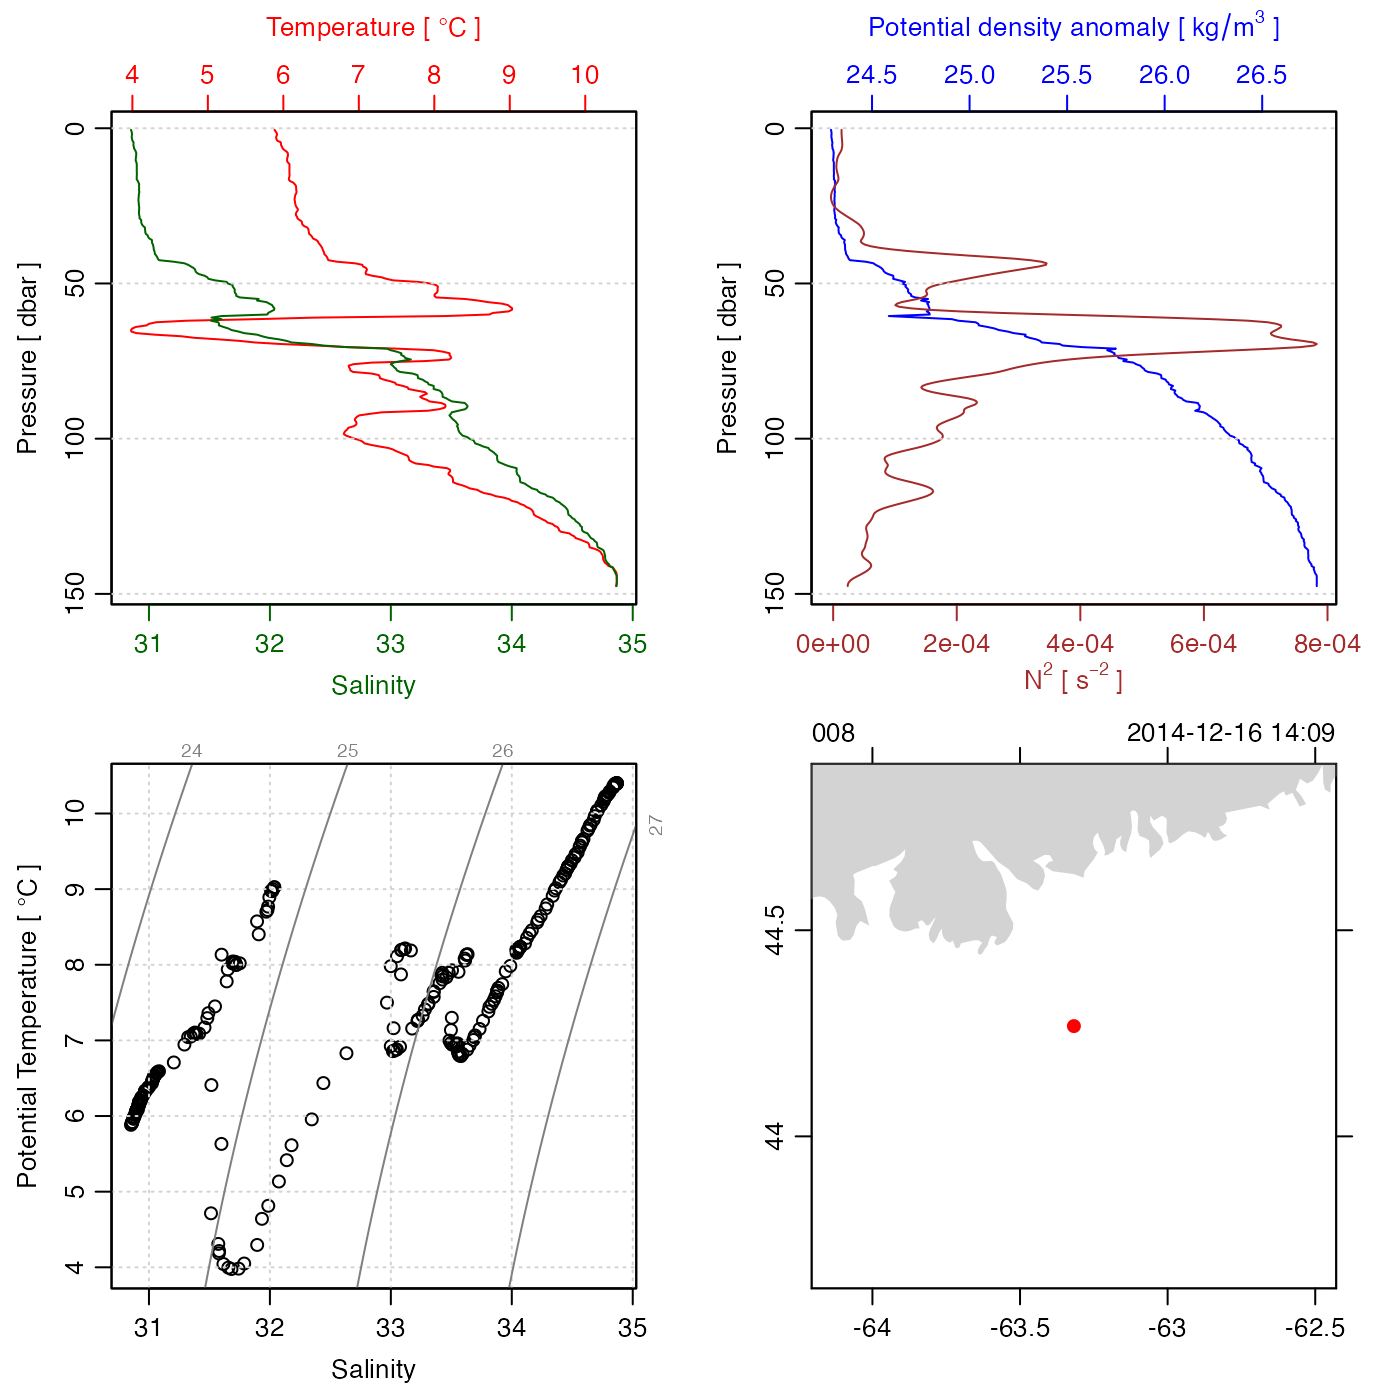
ctd <- read.ctd(system.file("extdata", "CTD_BCD2014666_008_1_DN.ODF.gz", package = "oce"))
#> Warning: "conductivity" (code name "CRAT_01") is a conductivity ratio, which has no units, but the file lists "s/m" as a unit. Consult ?read.odf to see how to rectify this error.
plot(ctd)