Create a coordinate reference string (CRS), suitable for use as a
projection argument to mapPlot() or plot,coastline-method().
Arguments
- region
character string indicating the region. This must be in the following list (or a string that matches to just one entry, with
pmatch()):"North Atlantic","South Atlantic","Atlantic","North Pacific","South Pacific","Pacific","Arctic", and"Antarctic".
Value
string contain a CRS, which can be used as projection
in mapPlot().
Caution
This is a preliminary version of this function, with the results being very likely to change through the autumn of 2016, guided by real-world usage.
See also
Other functions related to maps:
formatPosition(),
lonlat2map(),
lonlat2utm(),
map2lonlat(),
mapArrows(),
mapAxis(),
mapContour(),
mapCoordinateSystem(),
mapDirectionField(),
mapGrid(),
mapImage(),
mapLines(),
mapLocator(),
mapLongitudeLatitudeXY(),
mapPlot(),
mapPoints(),
mapPolygon(),
mapScalebar(),
mapText(),
mapTissot(),
oceProject(),
shiftLongitude(),
usrLonLat(),
utm2lonlat()
Examples
# \donttest{
library(oce)
data(coastlineWorld)
par(mar = c(2, 2, 1, 1))
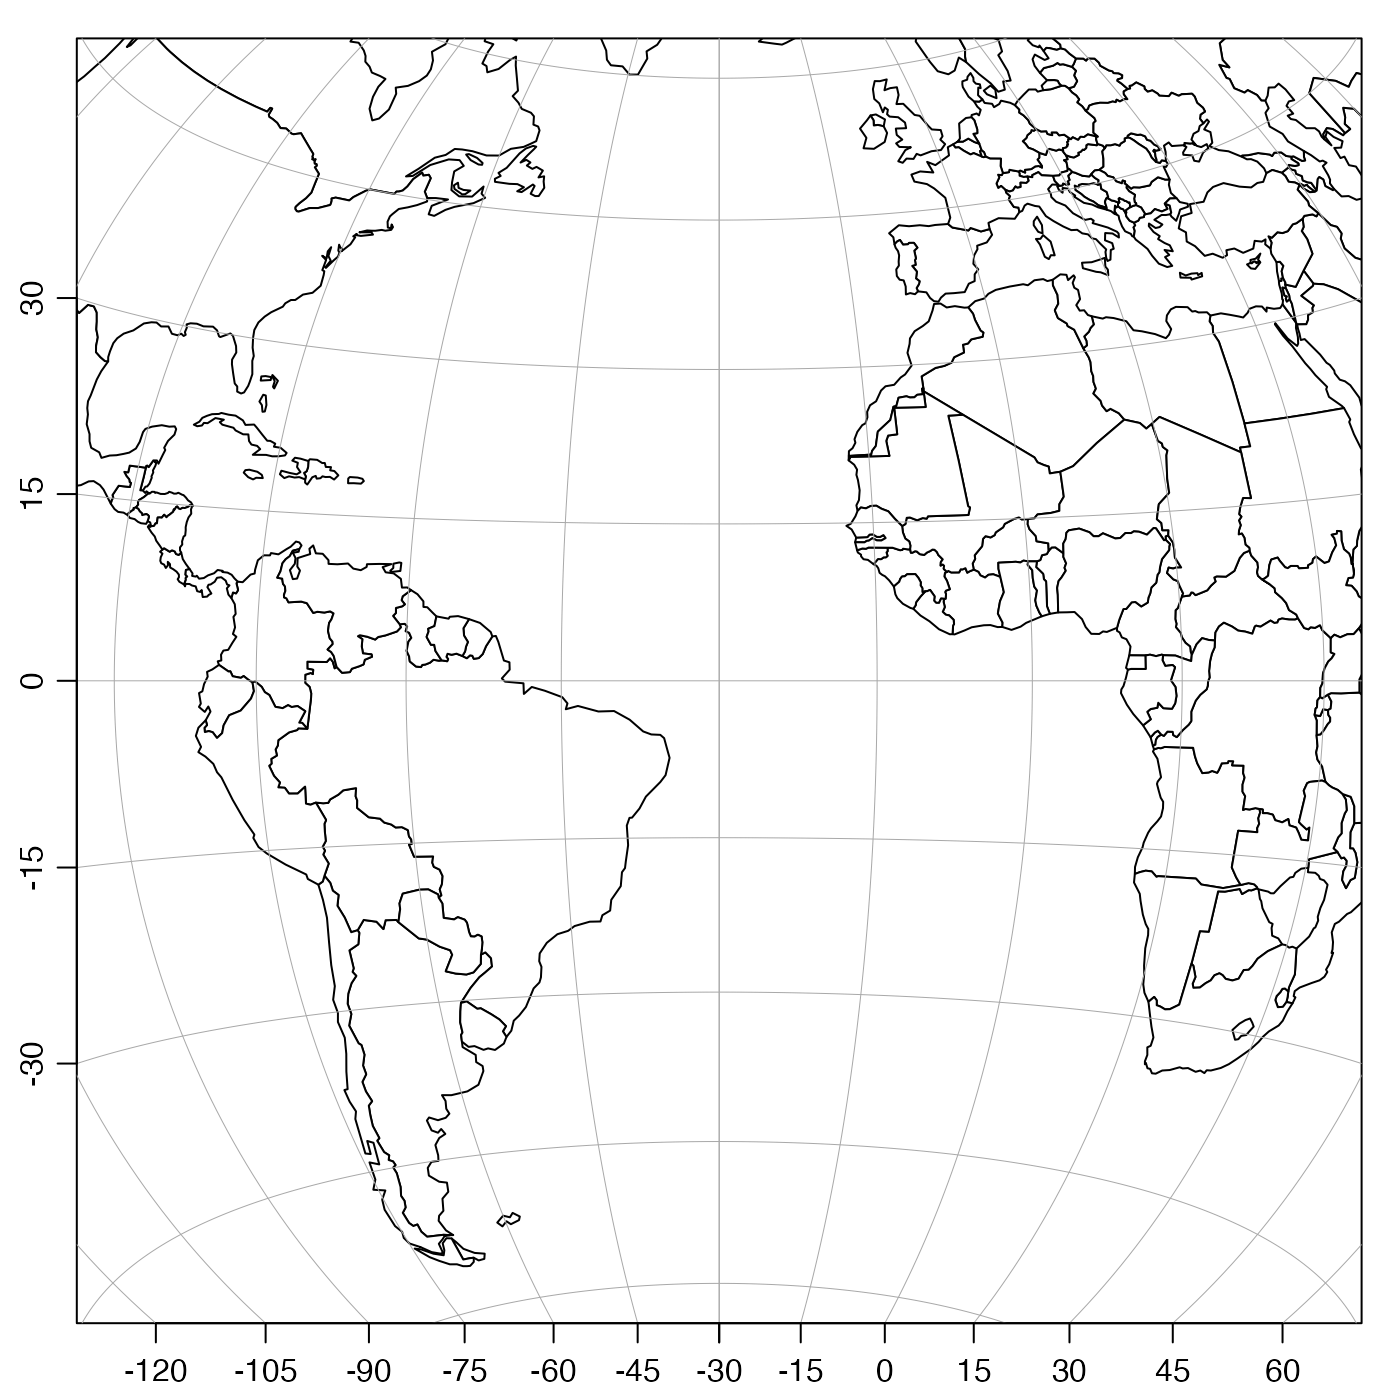
plot(coastlineWorld, projection = oceCRS("Atlantic"), span = 12000)
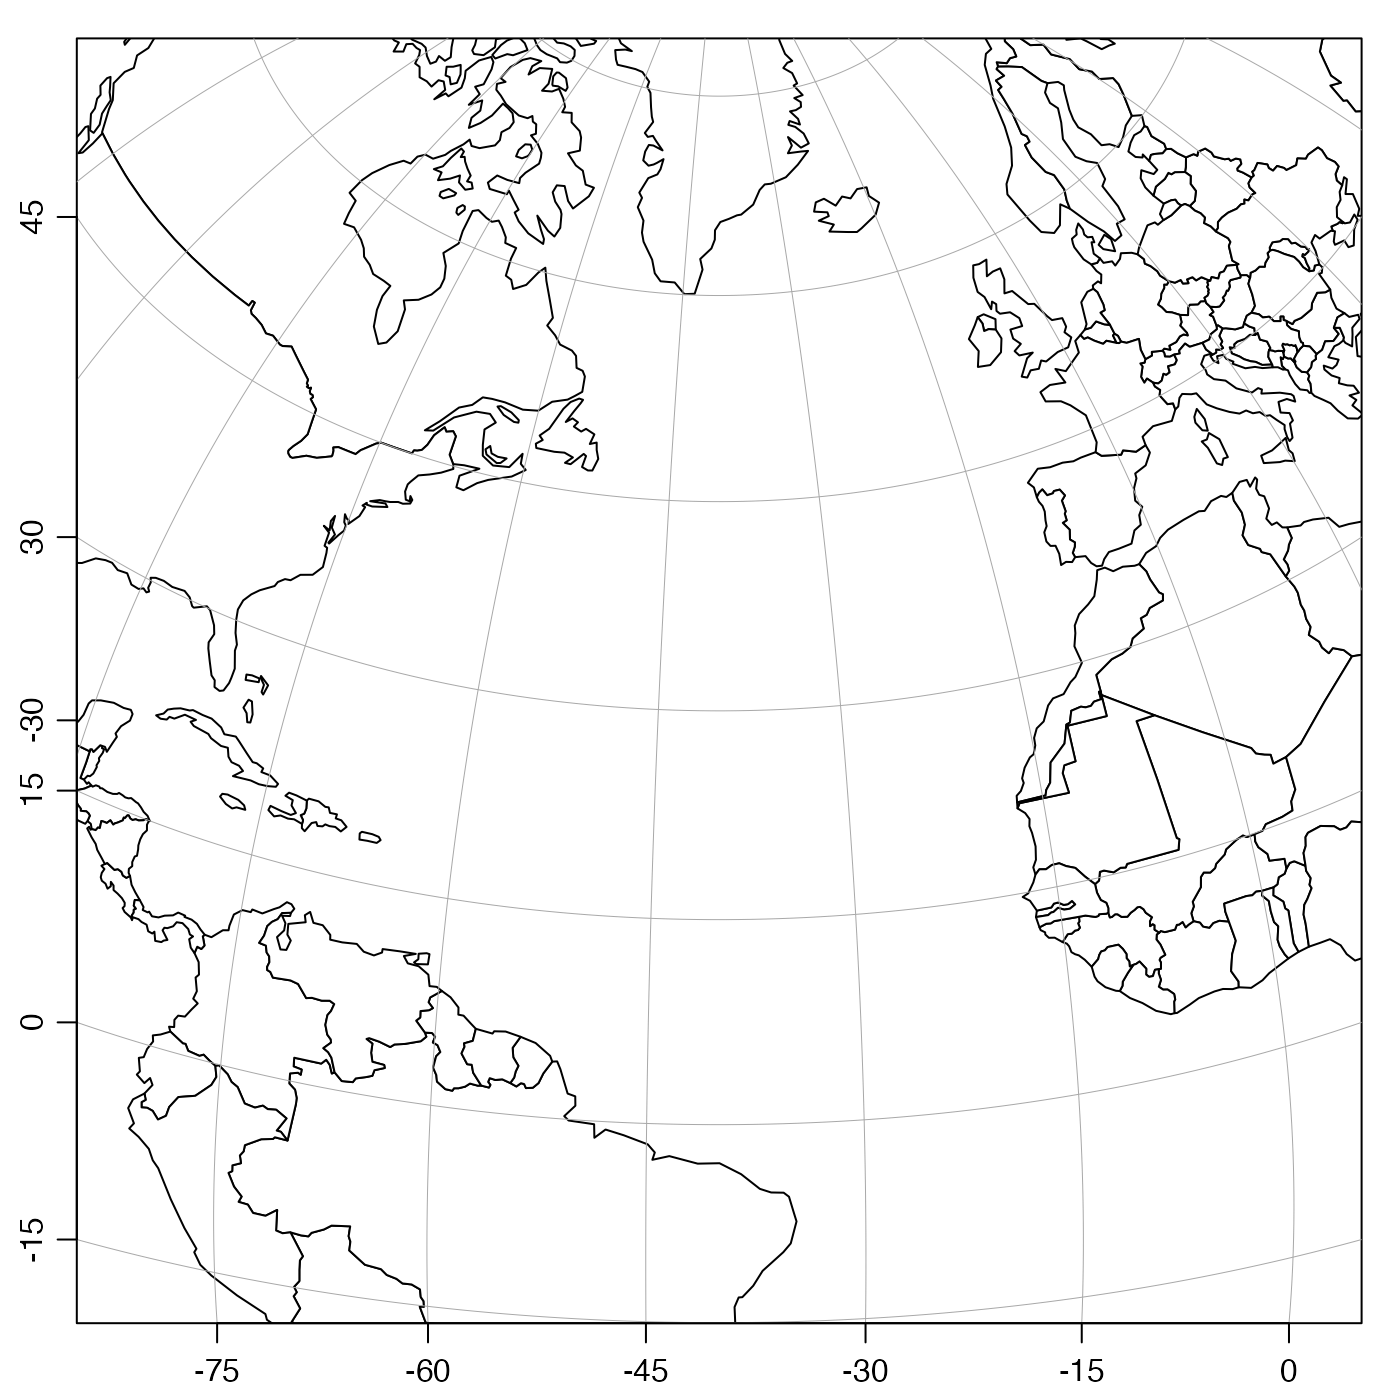
 plot(coastlineWorld, projection = oceCRS("North Atlantic"), span = 8000)
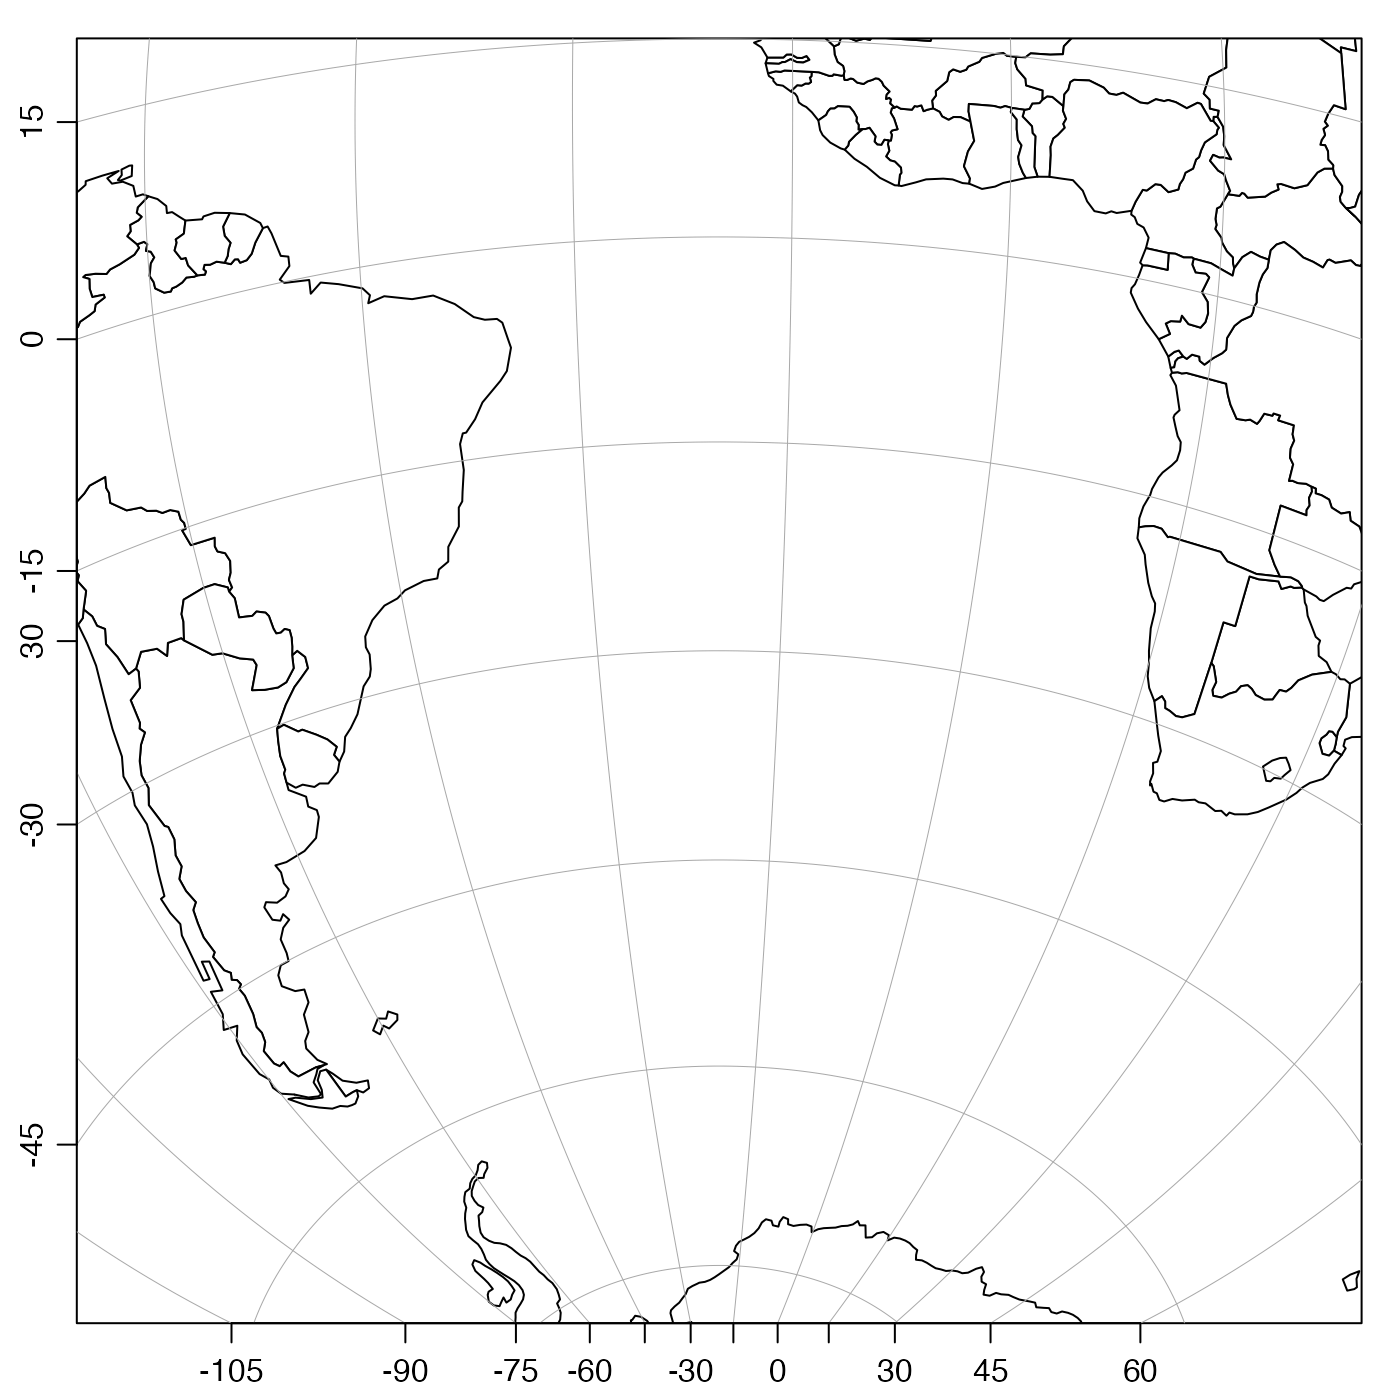
 plot(coastlineWorld, projection = oceCRS("South Atlantic"), span = 8000)
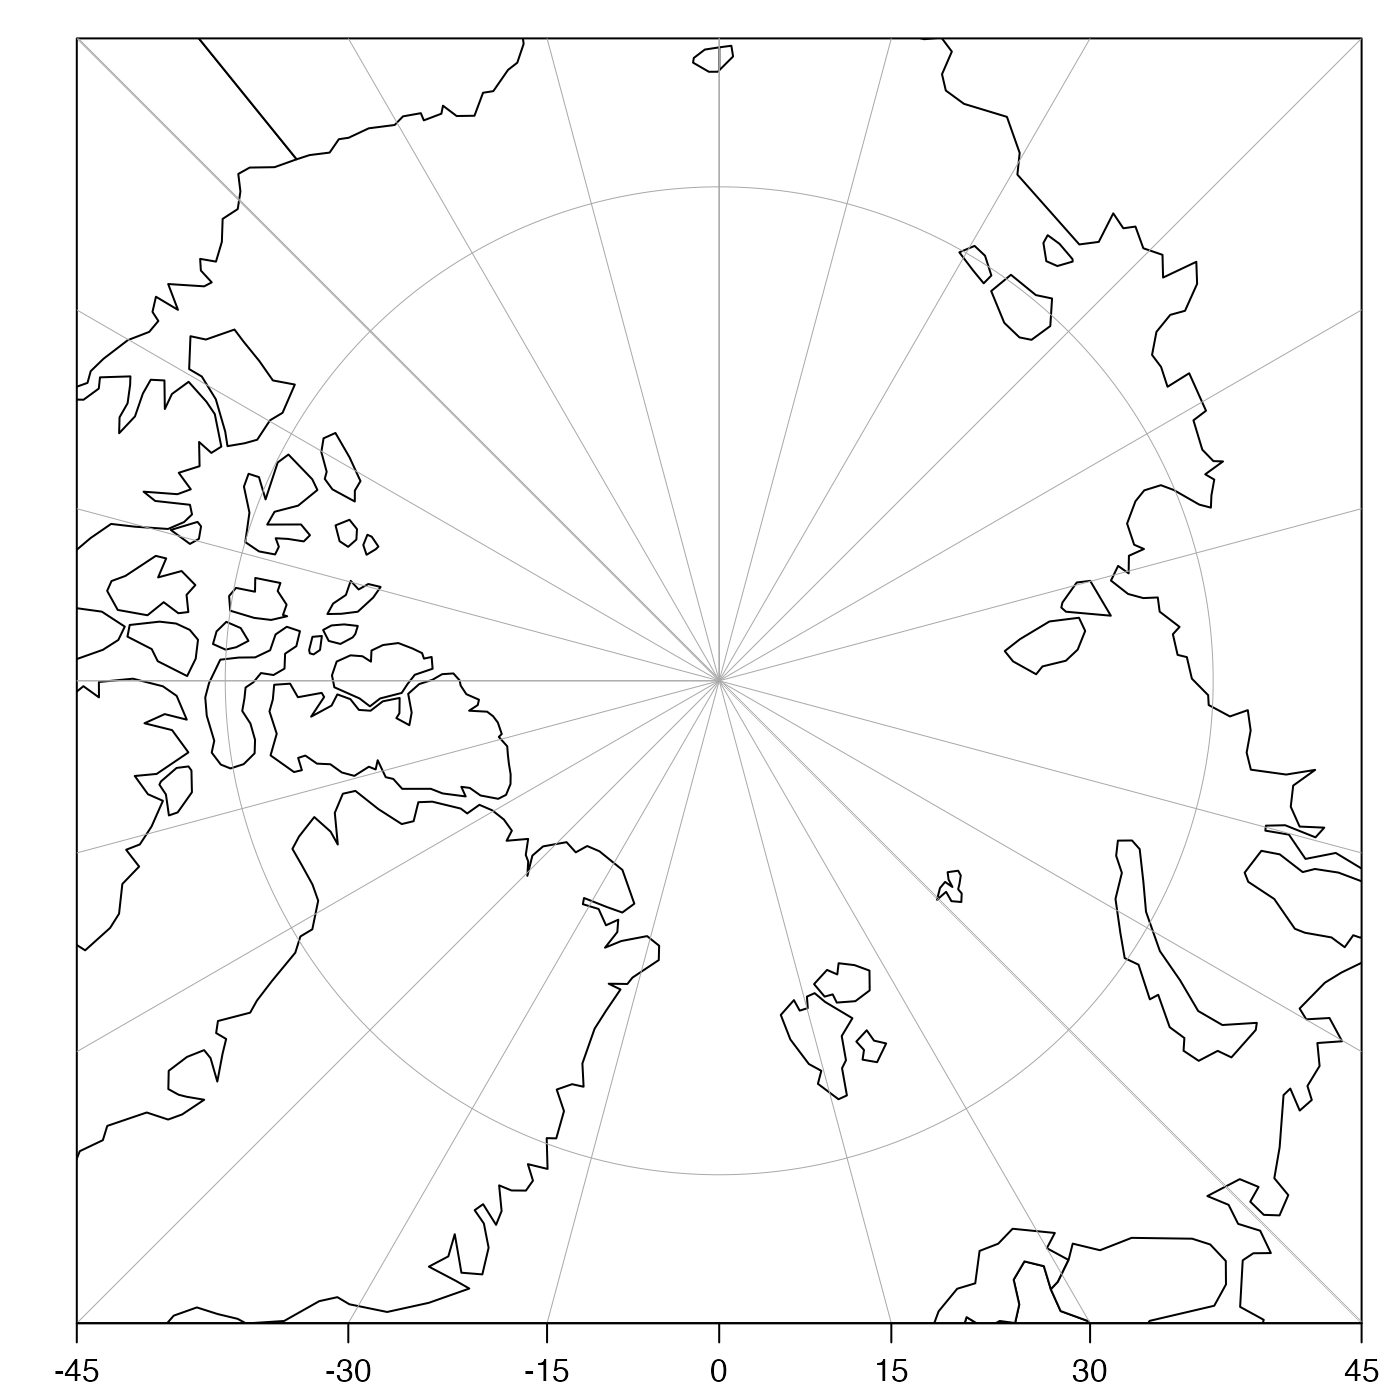
 plot(coastlineWorld, projection = oceCRS("Arctic"), span = 4000)
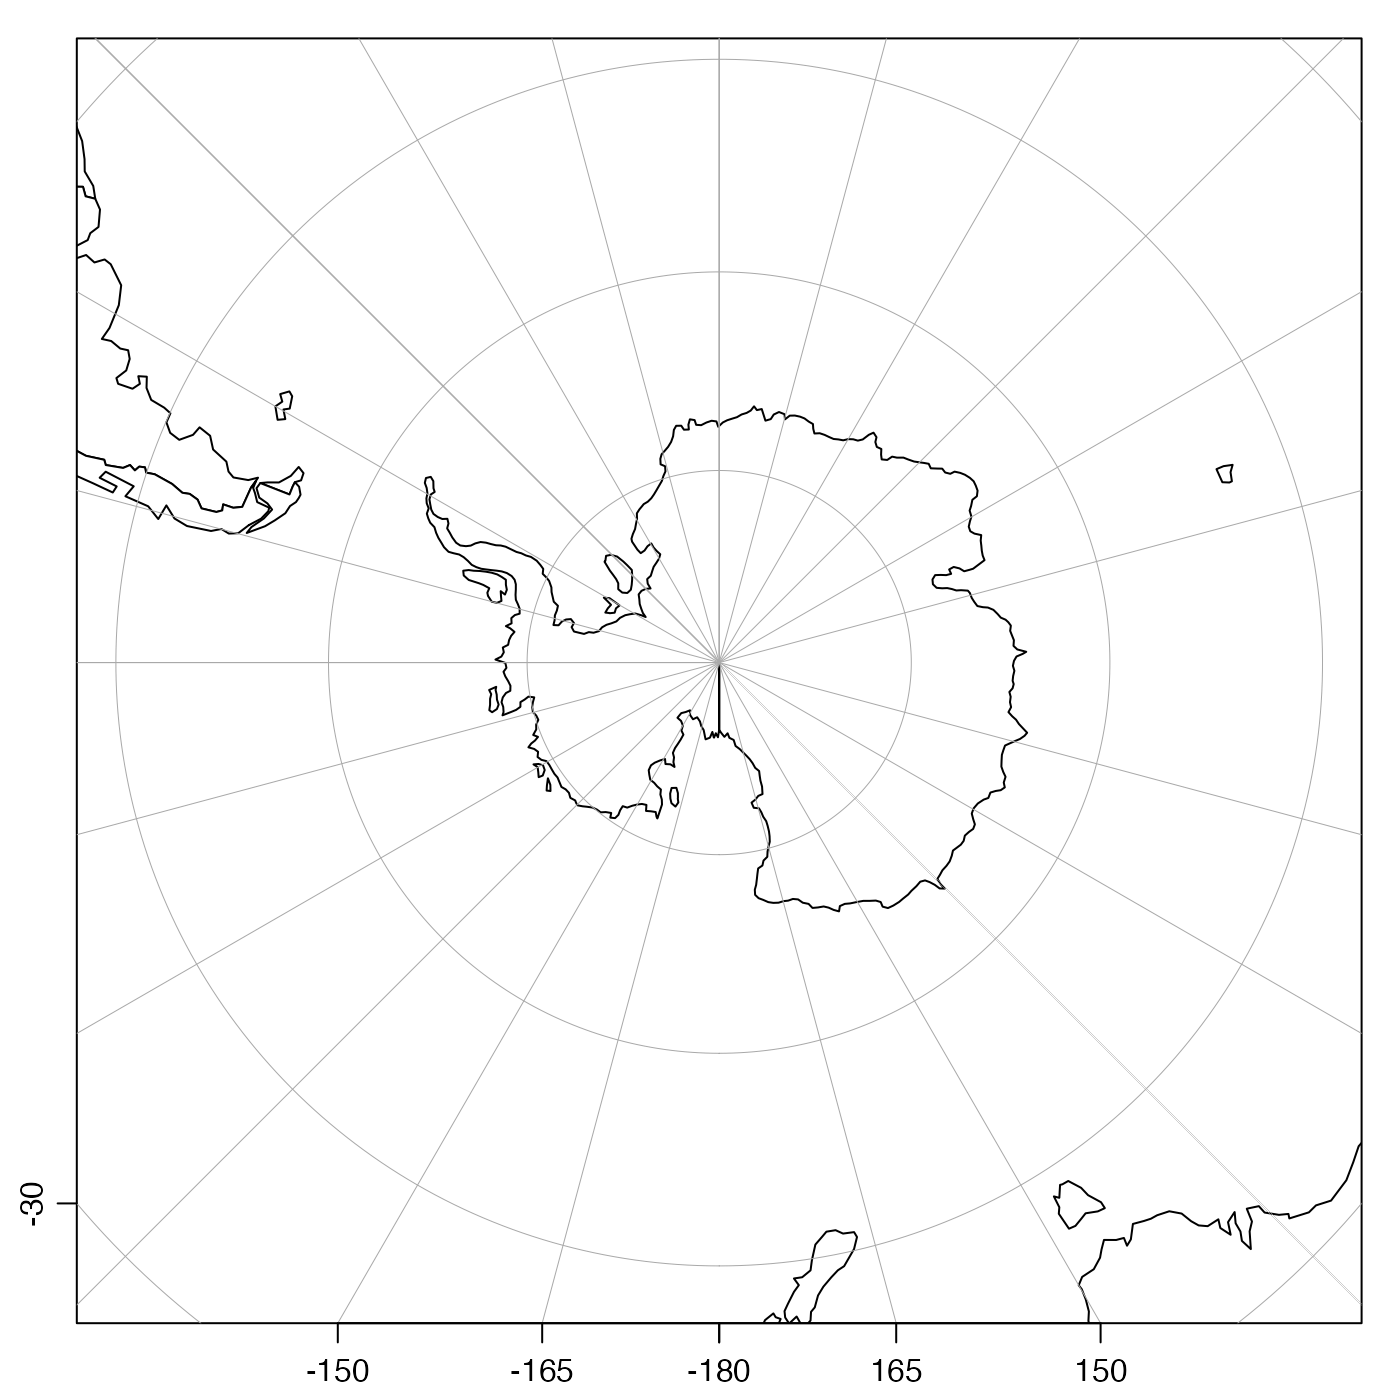
 plot(coastlineWorld, projection = oceCRS("Antarctic"), span = 10000)
 # Avoid ugly horizontal lines, an artifact of longitude shifting.
# Note: we cannot fill the land once we shift, either.
pacific <- coastlineCut(coastlineWorld, -180)
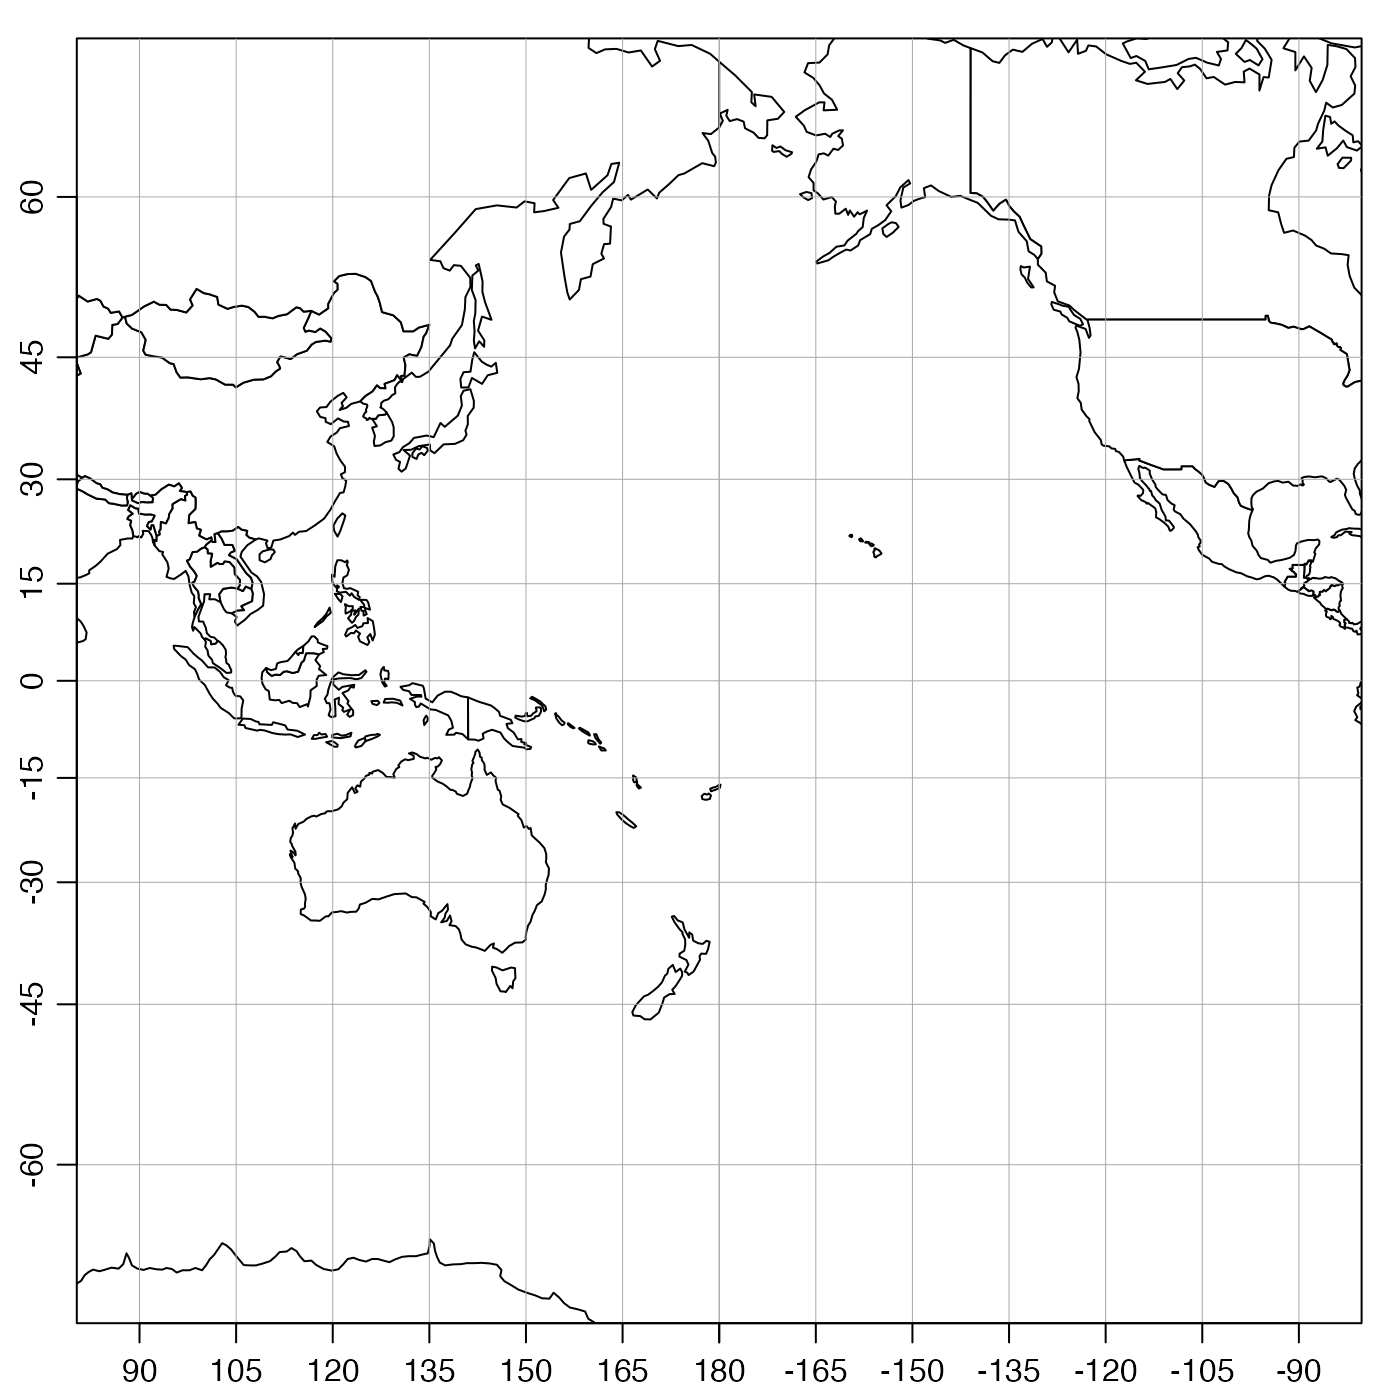
plot(pacific, proj = oceCRS("Pacific"), span = 15000, col = NULL)
# Avoid ugly horizontal lines, an artifact of longitude shifting.
# Note: we cannot fill the land once we shift, either.
pacific <- coastlineCut(coastlineWorld, -180)
plot(pacific, proj = oceCRS("Pacific"), span = 15000, col = NULL)
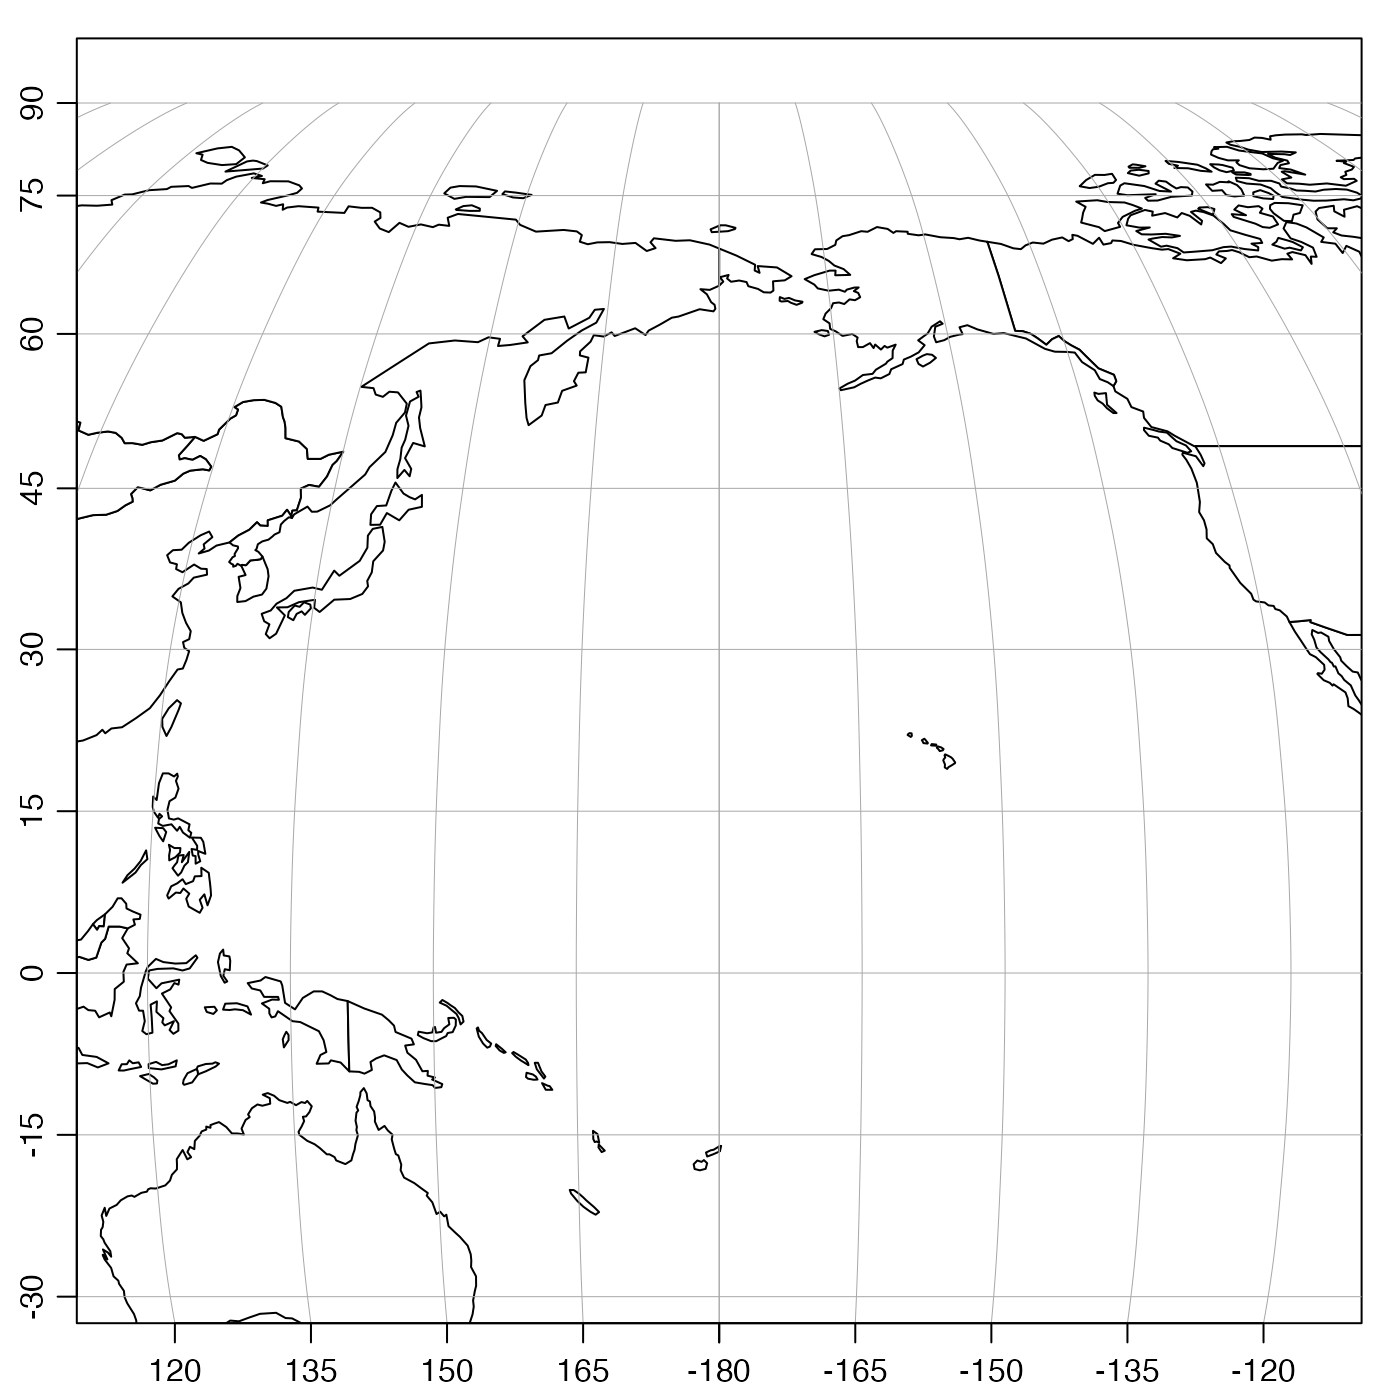
 plot(pacific, proj = oceCRS("North Pacific"), span = 12000, col = NULL)
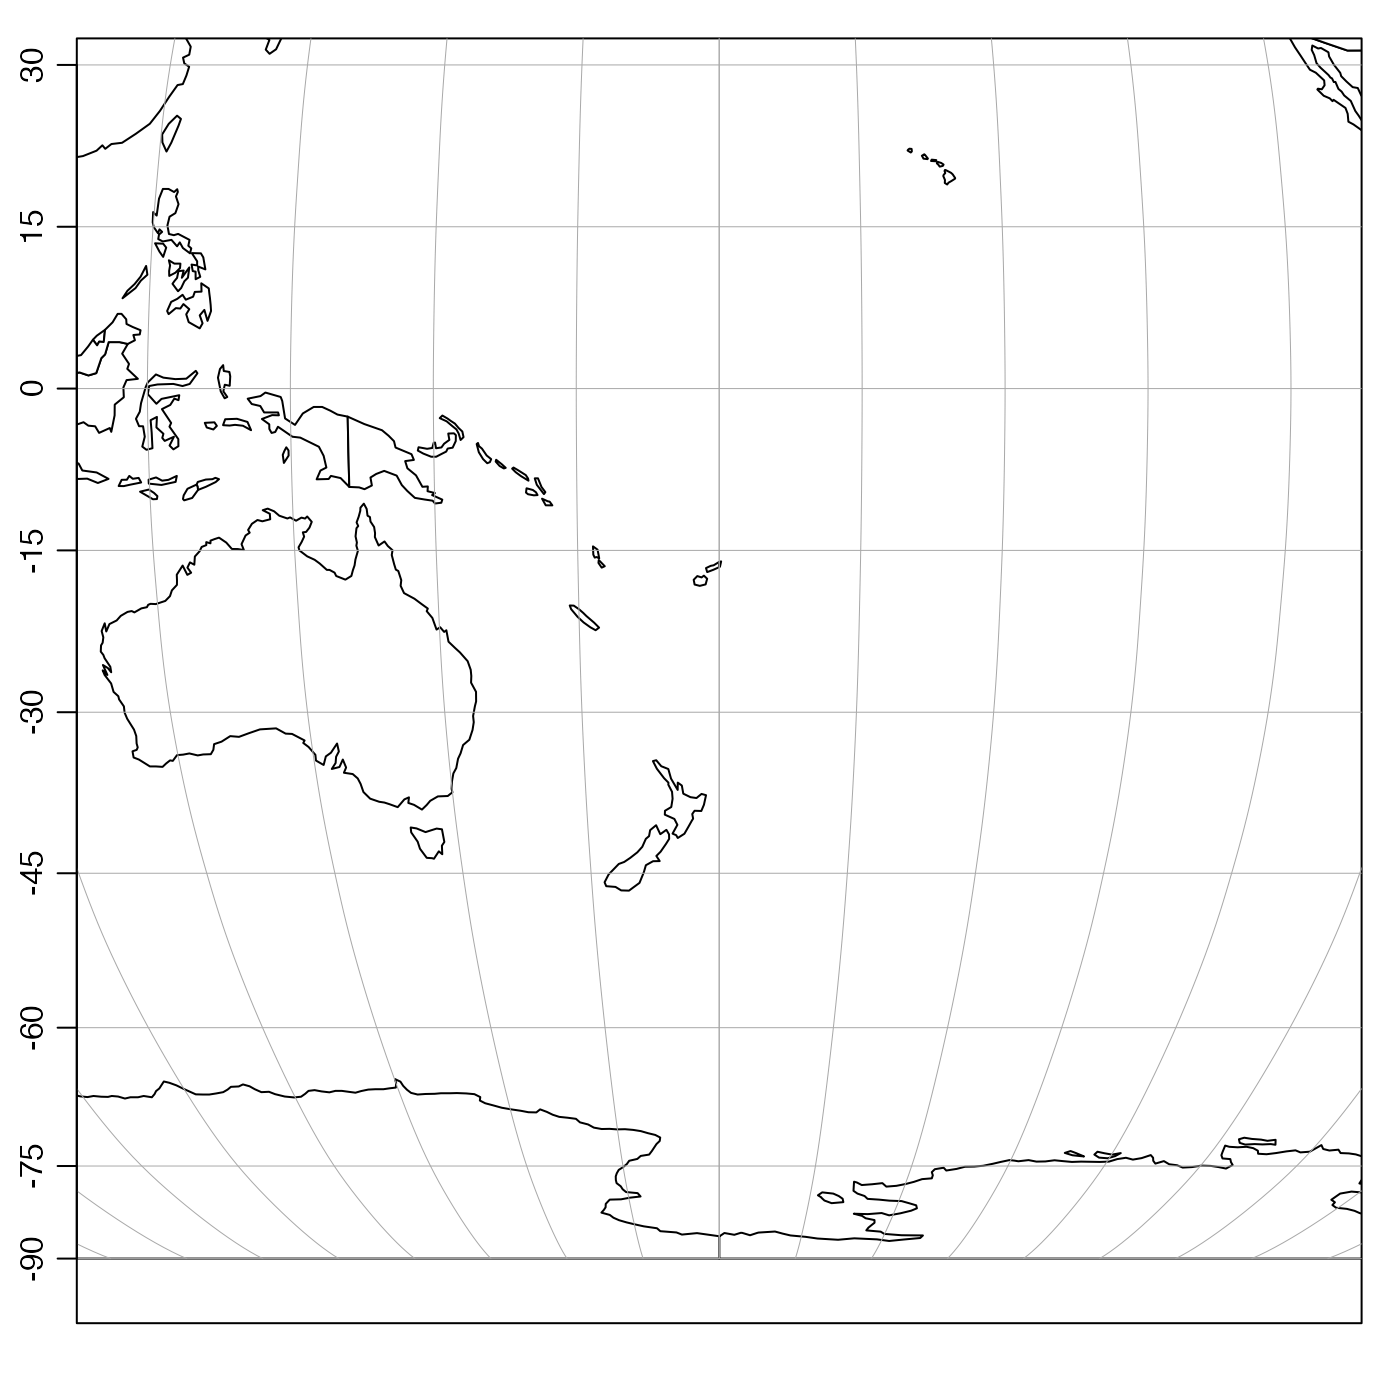
 plot(pacific, proj = oceCRS("South Pacific"), span = 12000, col = NULL)
 # }
# }