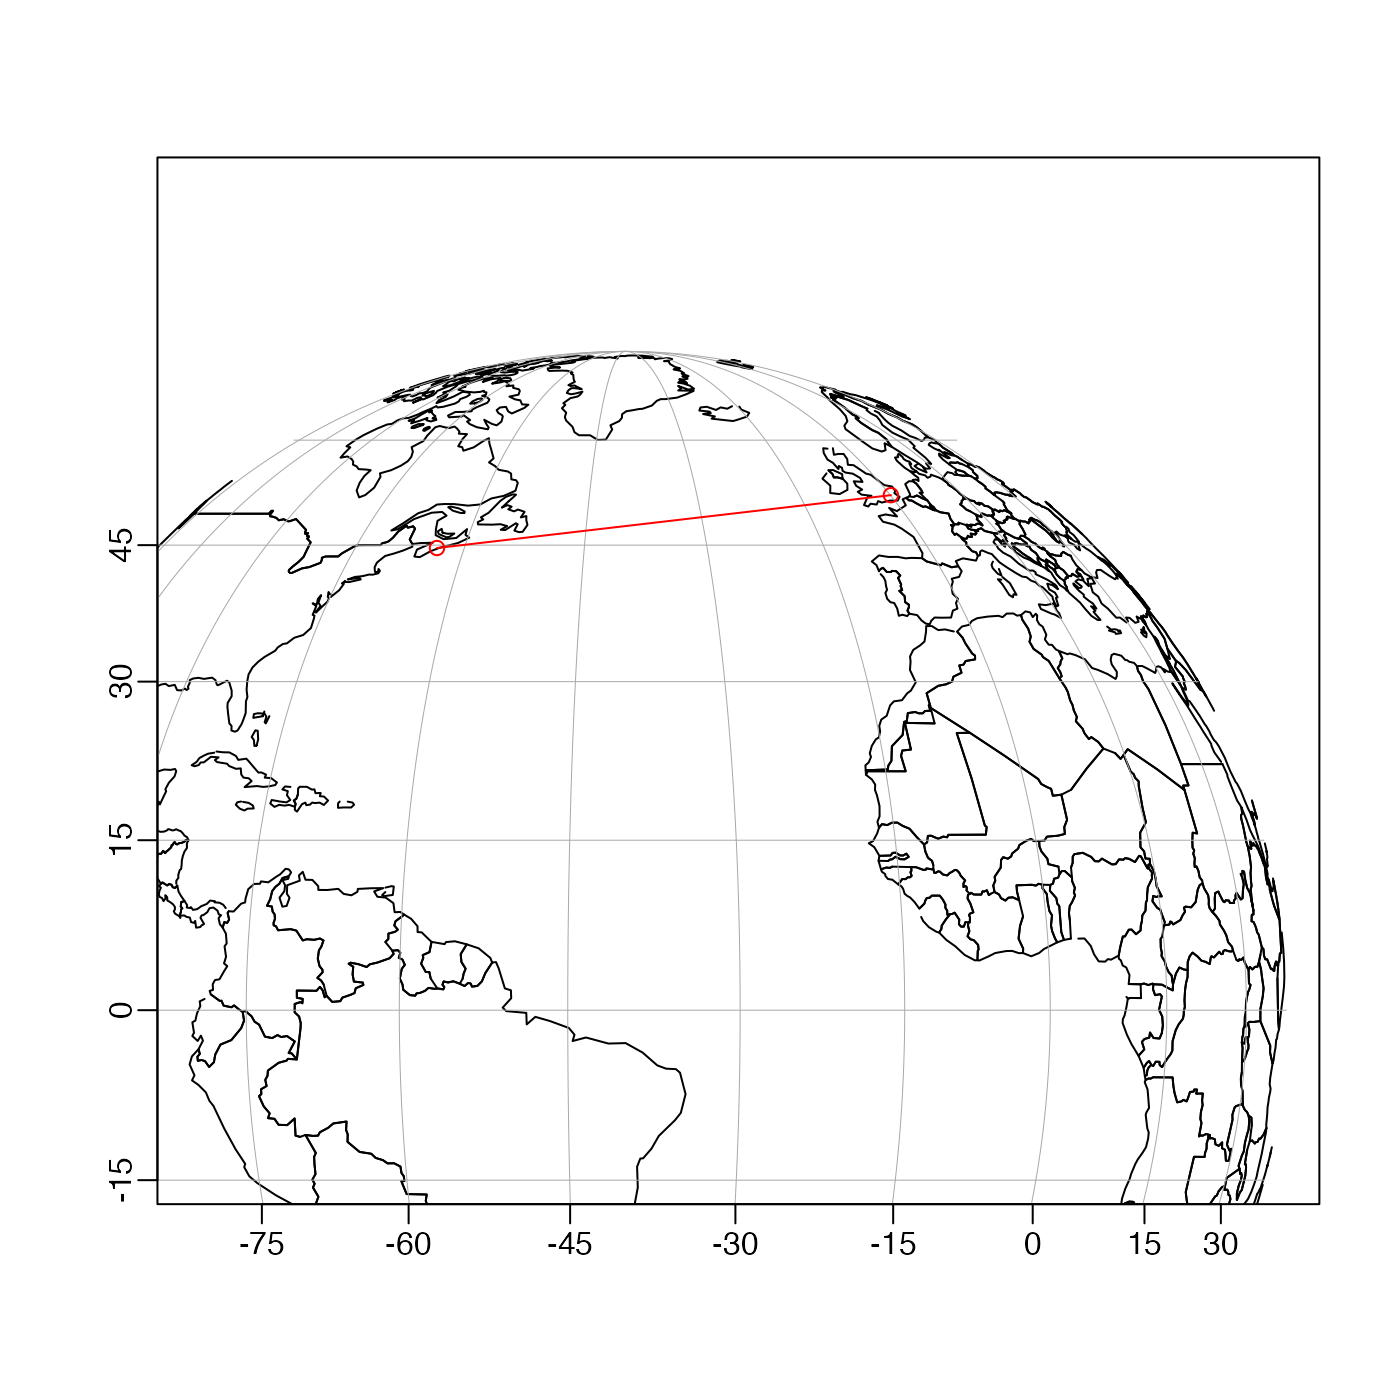
Plot lines on an existing map, by analogy to lines().
Arguments
- longitude
numeric vector of longitudes of points to be plotted, or an object from which longitude and latitude can be inferred (e.g. a coastline file, or the return value from
mapLocator()), in which case the following two arguments are ignored.- latitude
vector of latitudes of points to be plotted.
- greatCircle
a logical value indicating whether to render line segments as great circles. (Ignored.)
- ...
optional arguments passed to
lines().
See also
A map must first have been created with mapPlot().
Other functions related to maps:
formatPosition(),
lonlat2map(),
lonlat2utm(),
map2lonlat(),
mapArrows(),
mapAxis(),
mapContour(),
mapCoordinateSystem(),
mapDirectionField(),
mapGrid(),
mapImage(),
mapLocator(),
mapLongitudeLatitudeXY(),
mapPlot(),
mapPoints(),
mapPolygon(),
mapScalebar(),
mapText(),
mapTissot(),
oceCRS(),
oceProject(),
shiftLongitude(),
usrLonLat(),
utm2lonlat()
Examples
# \donttest{
if (utils::packageVersion("sf") != "0.9.8") {
    # sf version 0.9-8 has a problem with this projection
    library(oce)
    data(coastlineWorld)
    mapPlot(coastlineWorld,
        type = "l",
        longitudelim = c(-80, 10), latitudelim = c(0, 120),
        projection = "+proj=ortho +lon_0=-40"
    )
    lon <- c(-63.5744, 0.1062) # Halifax CA to London UK
    lat <- c(44.6479, 51.5171)
    mapPoints(lon, lat, col = "red")
    mapLines(lon, lat, col = "red")
}

# }
# }