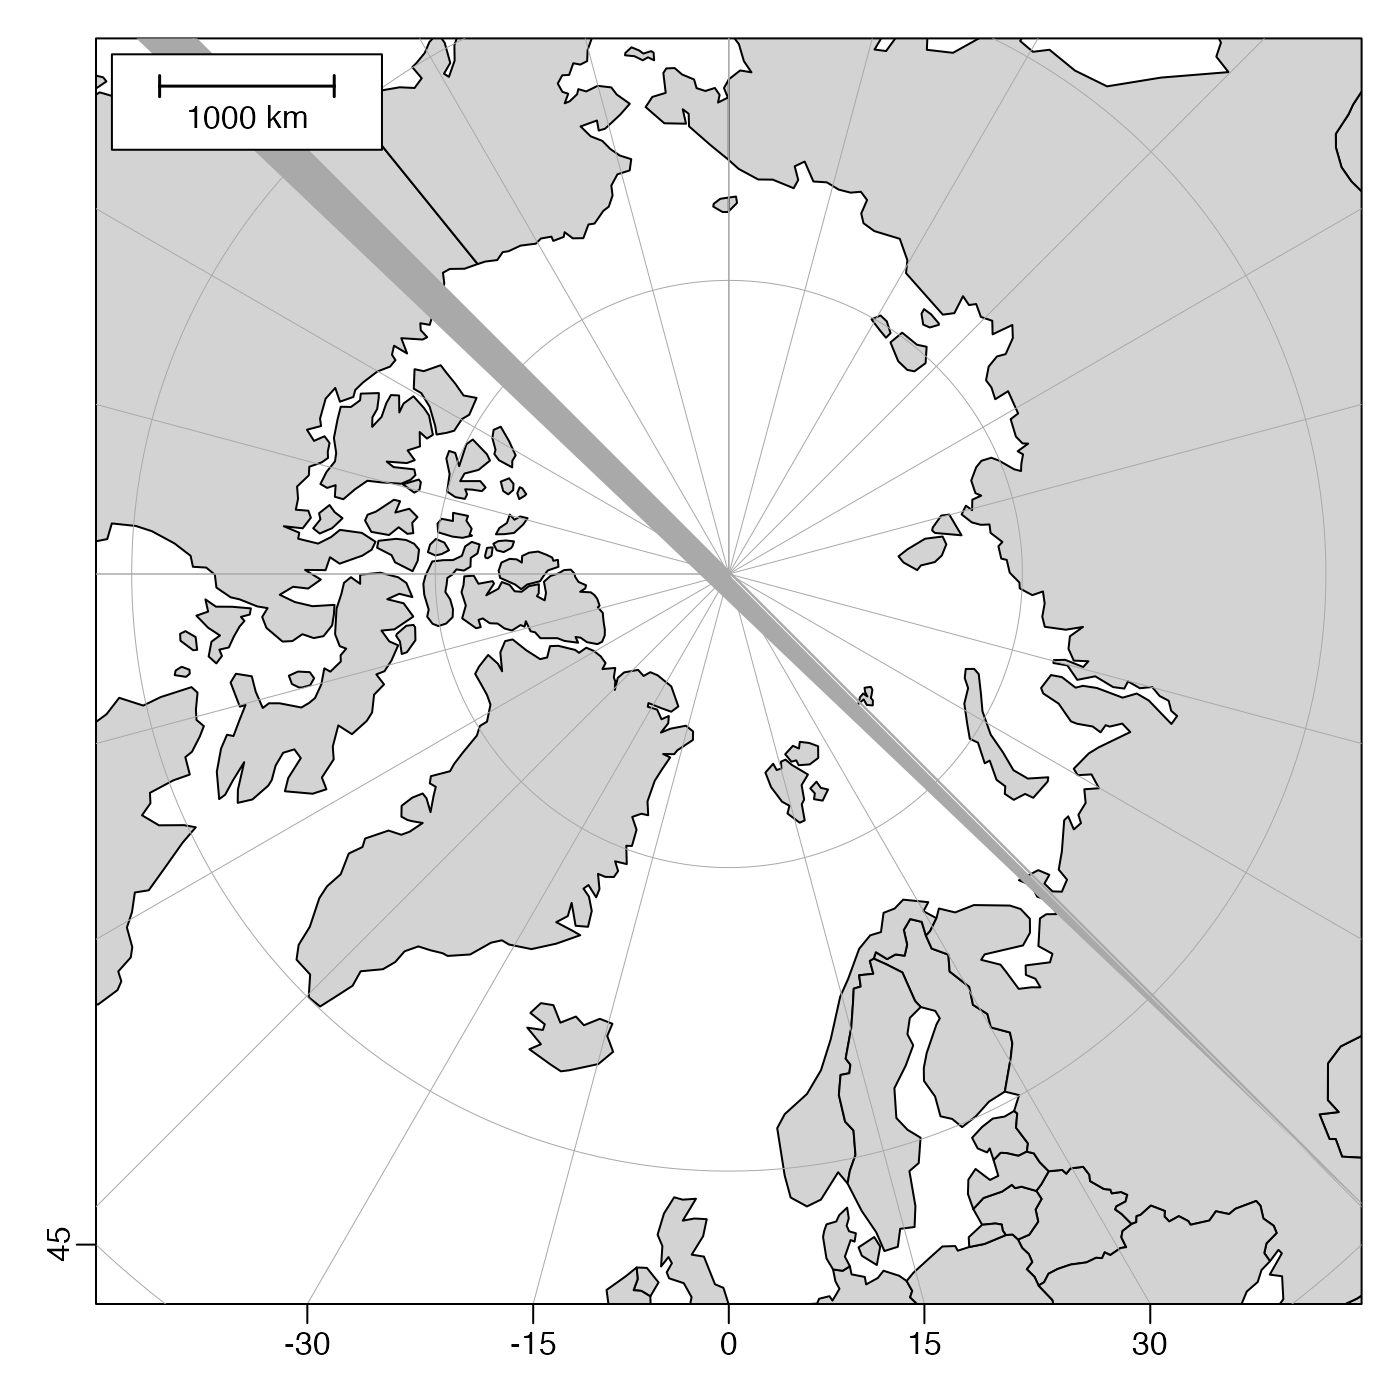
Draw a scalebar on a map created by mapPlot() or plot,coastline-method().
For plots made otherwise, see ‘Details’.
Arguments
- x, y
position of the scalebar. Eventually these two items may be handled similarly to the corresponding arguments in
legend(), but at the momentymust beNULLandxmust be"top","topleft"or"topright".- length
the distance to indicate, in kilometres. If not provided, a reasonable choice is made, based on the existing plot.
- lwd
line width of the scalebar.
- cex
character expansion factor for the scalebar text.
- col
color of the scalebar.
- debug
an integer specifying whether debugging information is to be printed during the processing. This is a general parameter that is used by many
ocefunctions. Generally, settingdebug=0turns off the printing, while higher values suggest that more information be printed. If one function calls another, it usually reduces the value ofdebugfirst, so that a user can often obtain deeper debugging by specifying higherdebugvalues.
Details
It is also possible to use this with any plot, but the results will
only make sense if the aspect ratio is set properly so that an item that is
circular in nature is (very closely) circular on the plot. This aspect ratio
condition is met by both mapPlot() and plot,coastline-method().
The scale is appropriate to the centre of the plot, and will become increasingly inaccurate away from that spot, with the error depending on the projection and the fraction of the earth that is shown.
See also
Other functions related to maps:
formatPosition(),
lonlat2map(),
lonlat2utm(),
map2lonlat(),
mapArrows(),
mapAxis(),
mapContour(),
mapCoordinateSystem(),
mapDirectionField(),
mapGrid(),
mapImage(),
mapLines(),
mapLocator(),
mapLongitudeLatitudeXY(),
mapPlot(),
mapPoints(),
mapPolygon(),
mapText(),
mapTissot(),
oceCRS(),
oceProject(),
shiftLongitude(),
usrLonLat(),
utm2lonlat()