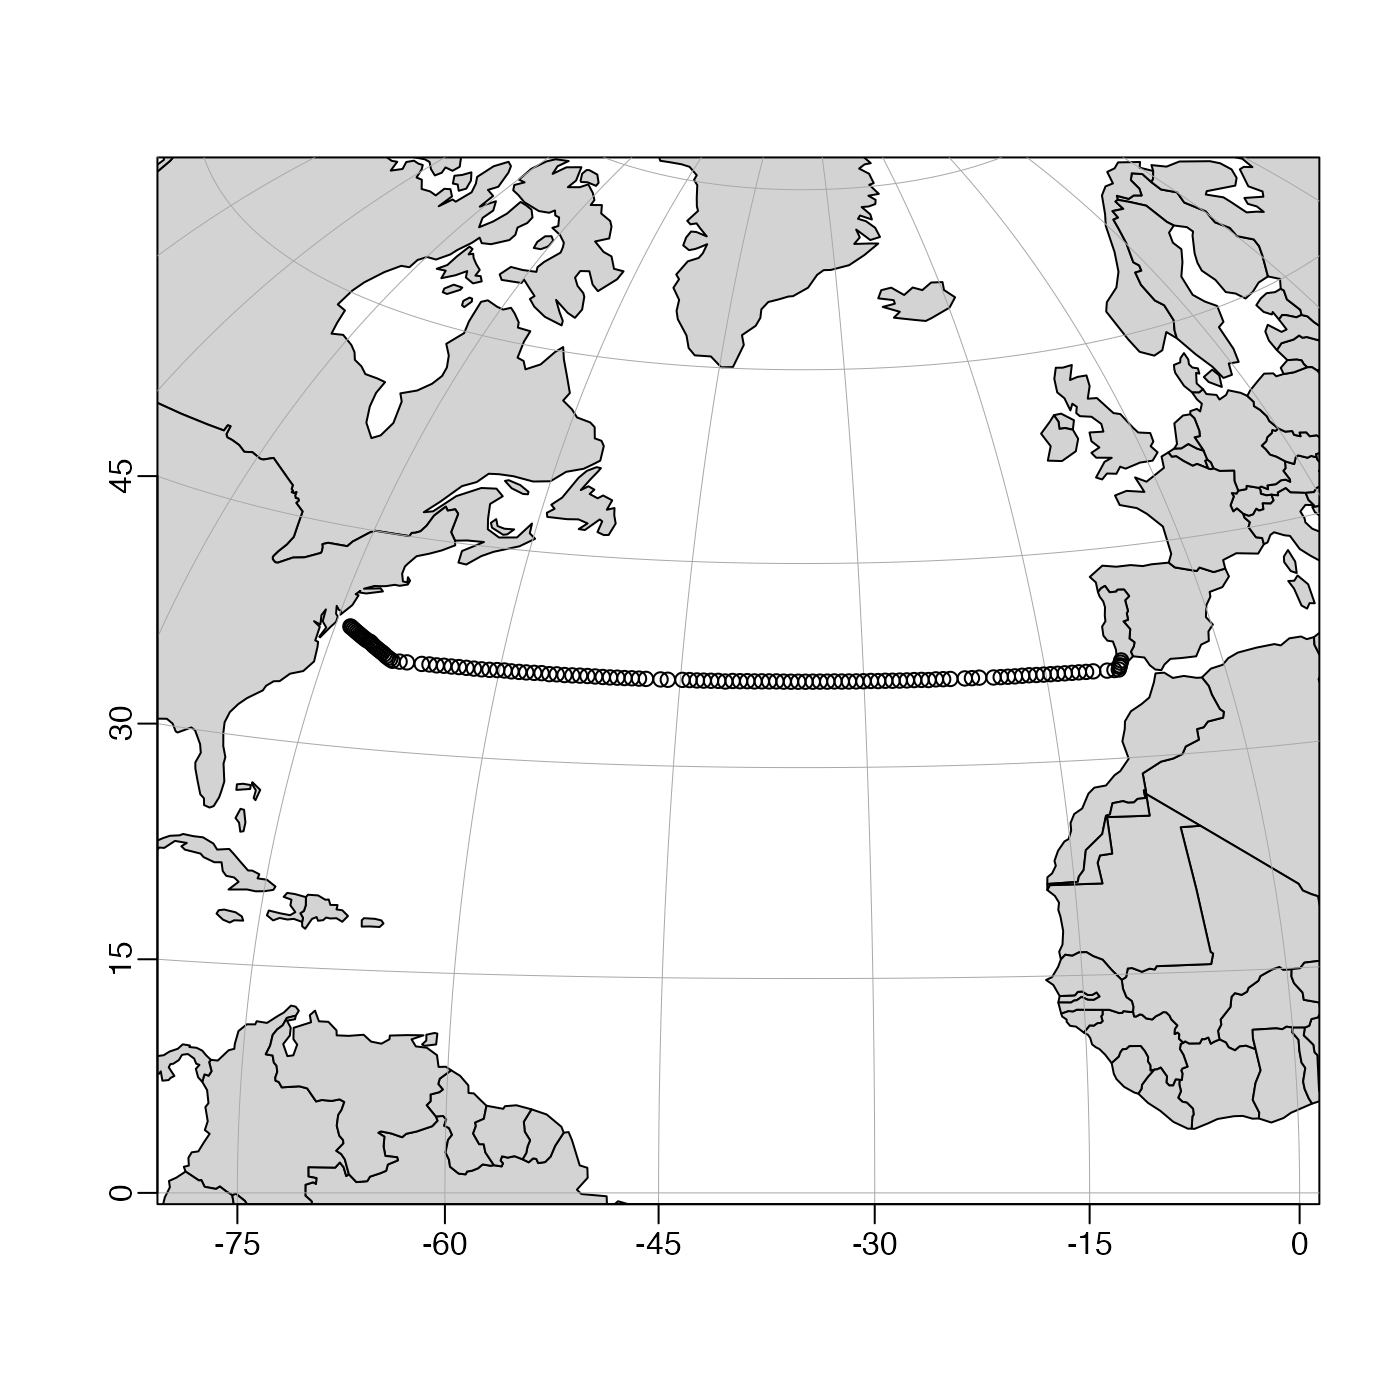
Plot points on an existing map, by analogy to points().
Usage
mapPoints(longitude, latitude, debug = getOption("oceDebug"), ...)Arguments
- longitude
Longitudes of points to be plotted, or an object from which longitude and latitude can be inferred in which case the following two arguments are ignored. This objects that are possible include those of type
coastline.- latitude
numeric vector of latitudes of points to be plotted.
- debug
A flag that turns on debugging. Set to 1 to get a moderate amount of debugging information, or to 2 to get more.
- ...
Optional arguments passed to
points().
See also
A map must first have been created with mapPlot().
A map must first have been created with mapPlot().
Other functions related to maps:
formatPosition(),
lonlat2map(),
lonlat2utm(),
map2lonlat(),
mapArrows(),
mapAxis(),
mapContour(),
mapCoordinateSystem(),
mapDirectionField(),
mapGrid(),
mapImage(),
mapLines(),
mapLocator(),
mapLongitudeLatitudeXY(),
mapPlot(),
mapPolygon(),
mapScalebar(),
mapText(),
mapTissot(),
oceCRS(),
oceProject(),
shiftLongitude(),
usrLonLat(),
utm2lonlat()