Plot arrows on an existing map, e.g. to indicate a place location.
This is not well-suited for drawing direction fields, e.g. of
velocities; for that, see mapDirectionField().
Adds arrows to an existing map, by analogy to arrows().
Arguments
- longitude0, latitude0
starting points for arrows.
- longitude1, latitude1
ending points for arrows.
- length
length of the arrow heads, passed to
arrows().- angle
angle of the arrow heads, passed to
arrows().- code
numerical code indicating the type of arrows, passed to
arrows().- col
arrow color, passed to
arrows().- lty
arrow line type, passed to
arrows().- lwd
arrow line width, passed to
arrows().- ...
optional arguments passed to
arrows().
See also
A map must first have been created with mapPlot().
Other functions related to maps:
formatPosition(),
lonlat2map(),
lonlat2utm(),
map2lonlat(),
mapAxis(),
mapContour(),
mapCoordinateSystem(),
mapDirectionField(),
mapGrid(),
mapImage(),
mapLines(),
mapLocator(),
mapLongitudeLatitudeXY(),
mapPlot(),
mapPoints(),
mapPolygon(),
mapScalebar(),
mapText(),
mapTissot(),
oceCRS(),
oceProject(),
shiftLongitude(),
usrLonLat(),
utm2lonlat()
Examples
# \donttest{
library(oce)
data(coastlineWorld)
mapPlot(coastlineWorld,
longitudelim = c(-120, -60), latitudelim = c(30, 60),
col = "lightgray", projection = "+proj=lcc +lat_1=45 +lon_0=-100"
)
lon <- seq(-120, -75, 15)
n <- length(lon)
lat <- 45 + rep(0, n)
# Draw meridional arrows in N America, from 45N to 60N.
mapArrows(lon, lat, lon, lat + 15, length = 0.05, col = "blue")
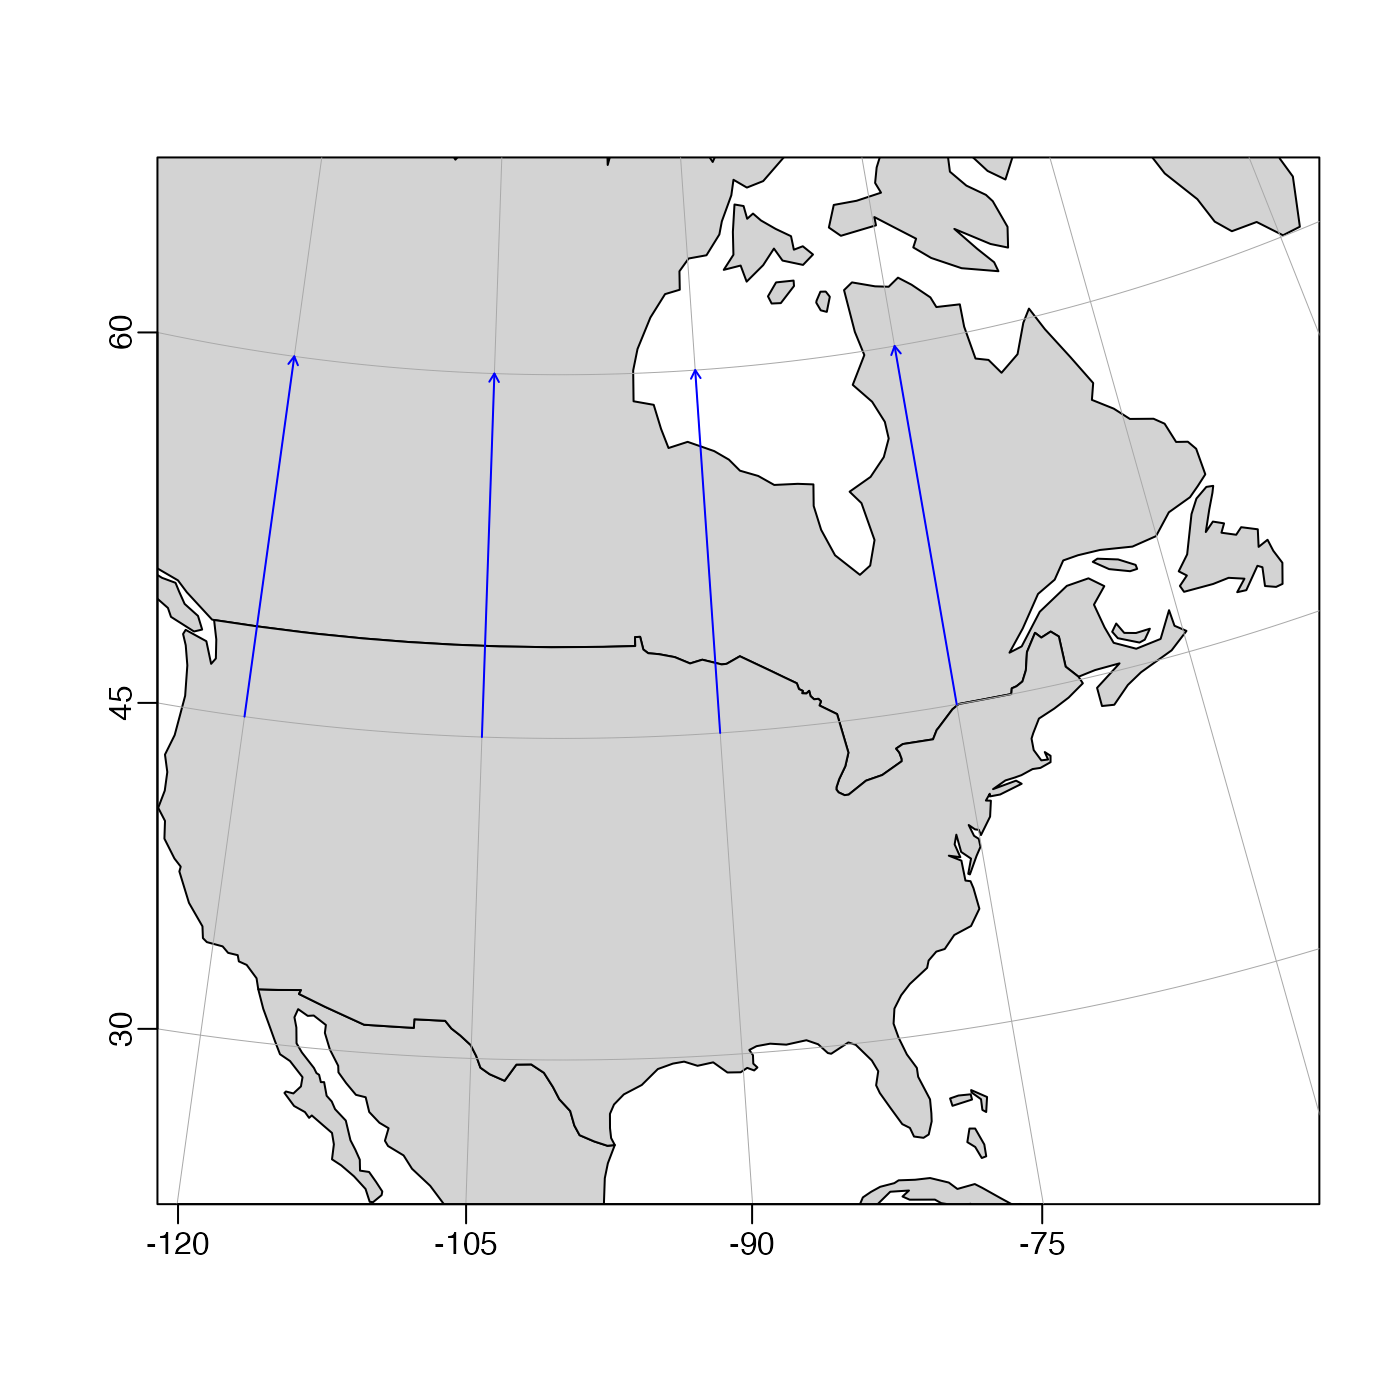 # }
# }