Plot text on an existing map, by analogy to text().
Arguments
- longitude
numeric vector of longitudes of text to be plotted.
- latitude
numeric vector of latitudes of text to be plotted.
- labels
vector of labels of text to be plotted.
- ...
optional arguments passed to
text(), e.g.adj,pos, etc.
See also
A map must first have been created with mapPlot().
Other functions related to maps:
formatPosition(),
lonlat2map(),
lonlat2utm(),
map2lonlat(),
mapArrows(),
mapAxis(),
mapContour(),
mapCoordinateSystem(),
mapDirectionField(),
mapGrid(),
mapImage(),
mapLines(),
mapLocator(),
mapLongitudeLatitudeXY(),
mapPlot(),
mapPoints(),
mapPolygon(),
mapScalebar(),
mapTissot(),
oceCRS(),
oceProject(),
shiftLongitude(),
usrLonLat(),
utm2lonlat()
Examples
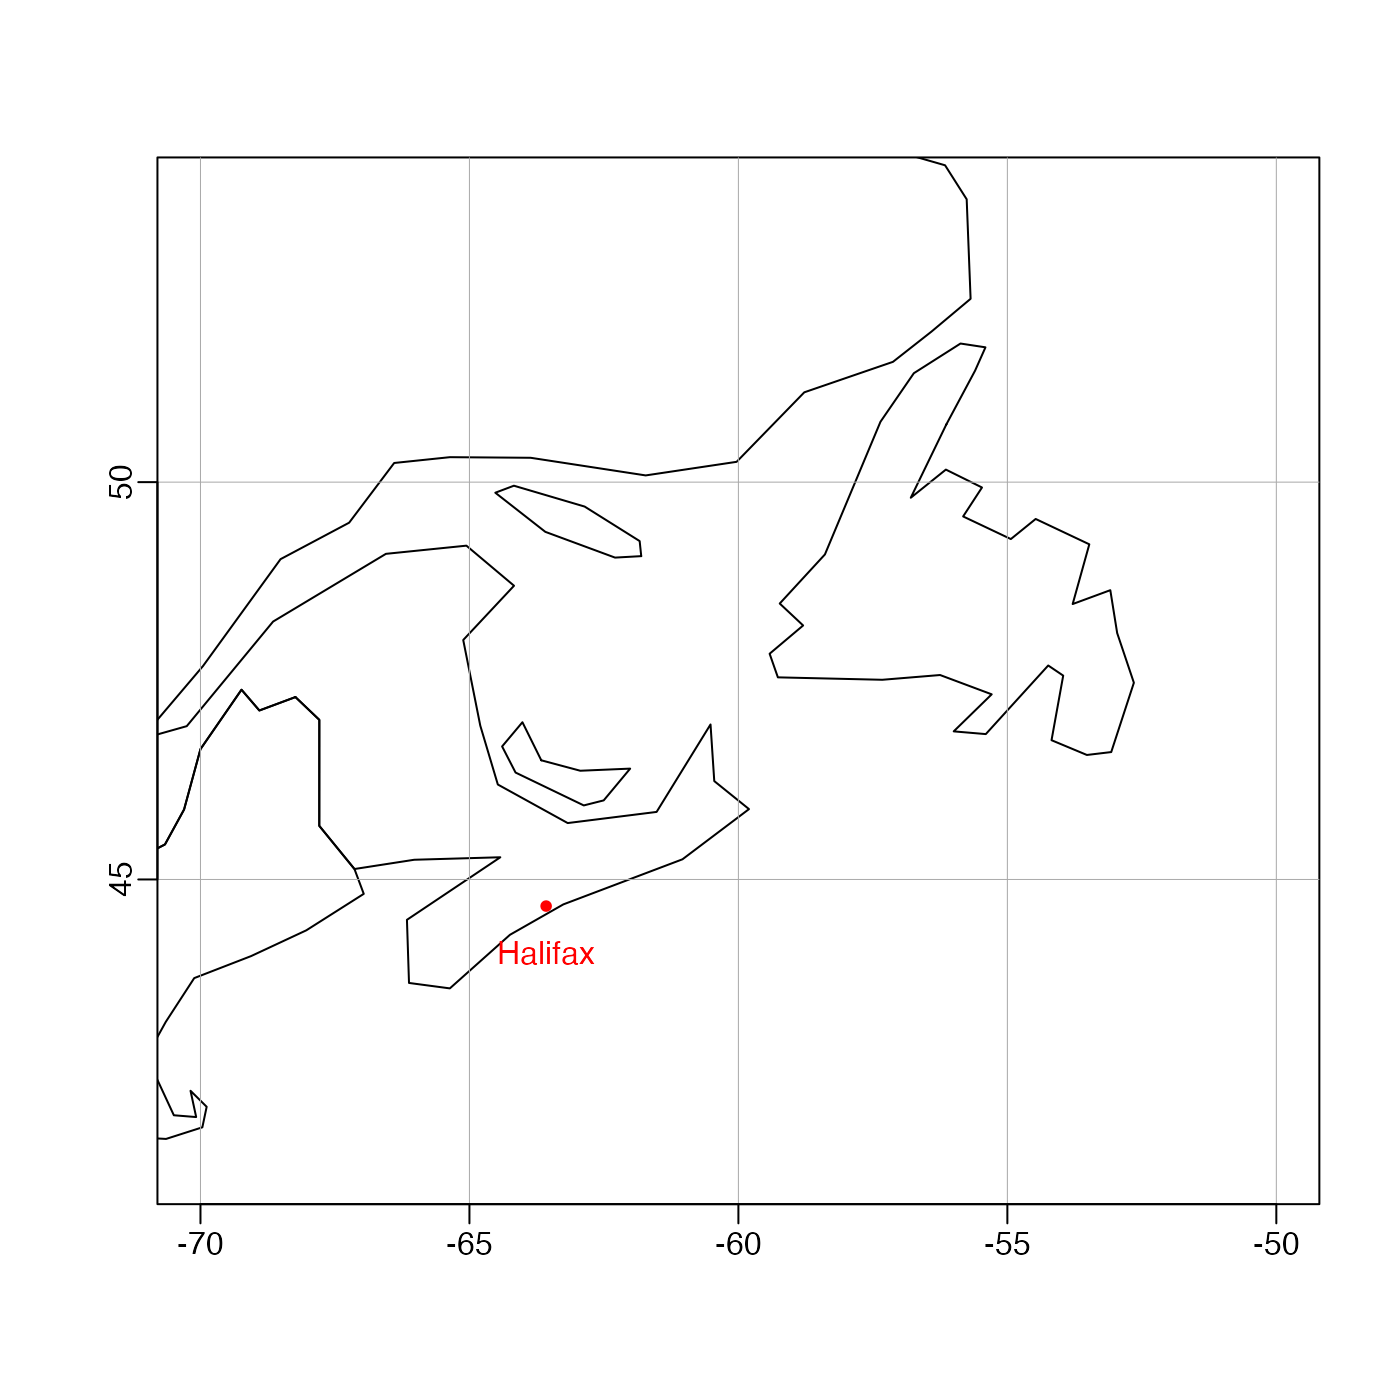
# \donttest{
library(oce)
data(coastlineWorld)
longitude <- coastlineWorld[["longitude"]]
latitude <- coastlineWorld[["latitude"]]
mapPlot(longitude, latitude,
    type = "l", grid = 5,
    longitudelim = c(-70, -50), latitudelim = c(45, 50),
    projection = "+proj=merc"
)
lon <- -63.5744 # Halifax
lat <- 44.6479
mapPoints(lon, lat, pch = 20, col = "red")
mapText(lon, lat, "Halifax", col = "red", pos = 1, offset = 1)

# }
# }