Compensate ADP signal strength for spherical spreading.
Arguments
- x
an adp object.
- count2db
a set of coefficients, one per beam, to convert from beam echo intensity to decibels.
- asMatrix
a boolean that indicates whether to return a numeric matrix, as opposed to returning an updated object (in which the matrix is cast to a raw value).
- debug
an integer specifying whether debugging information is to be printed during the processing. This is a general parameter that is used by many
ocefunctions. Generally, settingdebug=0turns off the printing, while higher values suggest that more information be printed. If one function calls another, it usually reduces the value ofdebugfirst, so that a user can often obtain deeper debugging by specifying higherdebugvalues.
Value
An adp object.
Details
First, beam echo intensity is converted from counts to decibels, by
multiplying by count2db. Then, the signal decrease owing to
spherical spreading is compensated for by adding the term
\(20\log10(r)\), where \(r\) is the distance from the
sensor head to the water from which scattering is occurring. \(r\) is
given by x[["distance"]].
References
The coefficient to convert to decibels is a personal communication. The logarithmic term is explained in textbooks on acoustics, optics, etc.
See also
Other things related to adp data:
[[,adp-method,
[[<-,adp-method,
ad2cpCodeToName(),
ad2cpHeaderValue(),
adp,
adp-class,
adpAd2cpFileTrim(),
adpConvertRawToNumeric(),
adpEnsembleAverage(),
adpFlagPastBoundary(),
adpRdiFileTrim(),
adp_rdi.000,
applyMagneticDeclination,adp-method,
as.adp(),
beamName(),
beamToXyz(),
beamToXyzAdp(),
beamToXyzAdpAD2CP(),
beamToXyzAdv(),
binmapAdp(),
enuToOther(),
enuToOtherAdp(),
handleFlags,adp-method,
is.ad2cp(),
plot,adp-method,
read.adp(),
read.adp.ad2cp(),
read.adp.nortek(),
read.adp.rdi(),
read.adp.sontek(),
read.adp.sontek.serial(),
read.aquadopp(),
read.aquadoppHR(),
read.aquadoppProfiler(),
rotateAboutZ(),
setFlags,adp-method,
subset,adp-method,
subtractBottomVelocity(),
summary,adp-method,
toEnu(),
toEnuAdp(),
velocityStatistics(),
xyzToEnu(),
xyzToEnuAdp(),
xyzToEnuAdpAD2CP()
Examples
library(oce)
data(adp)
plot(adp, which = 5) # beam 1 echo intensity
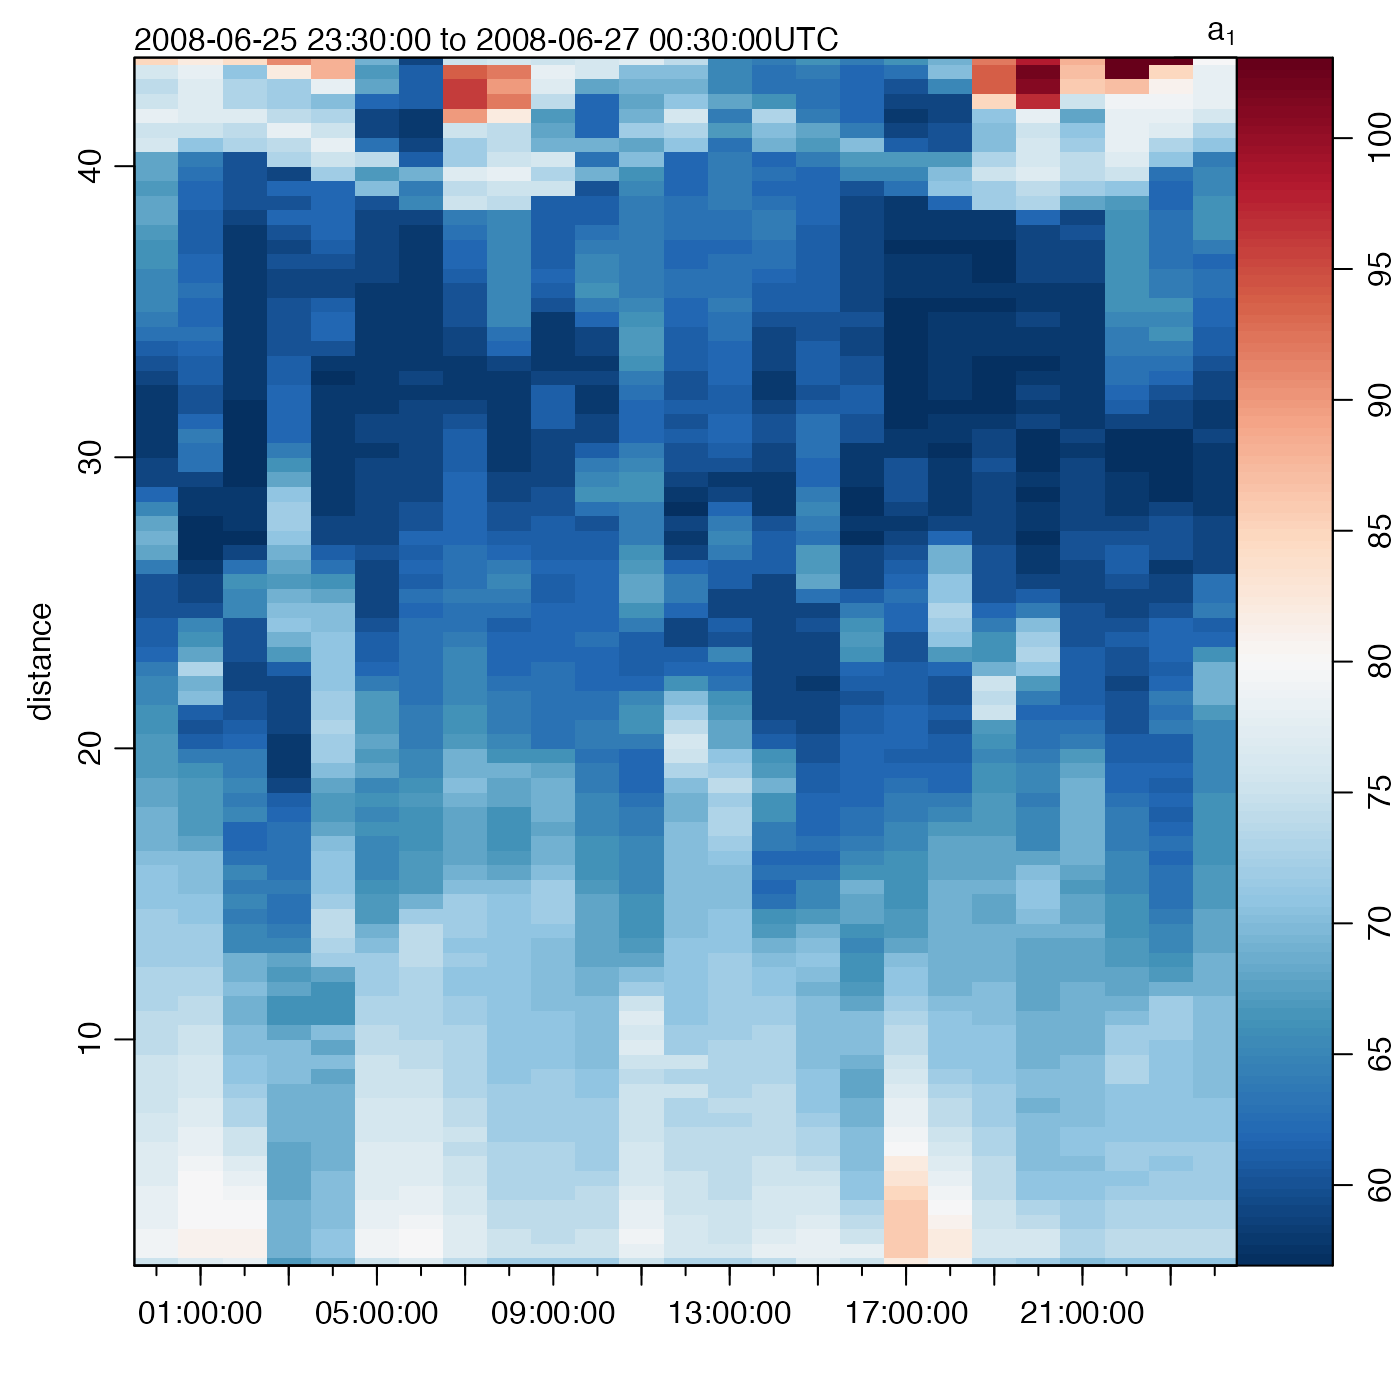
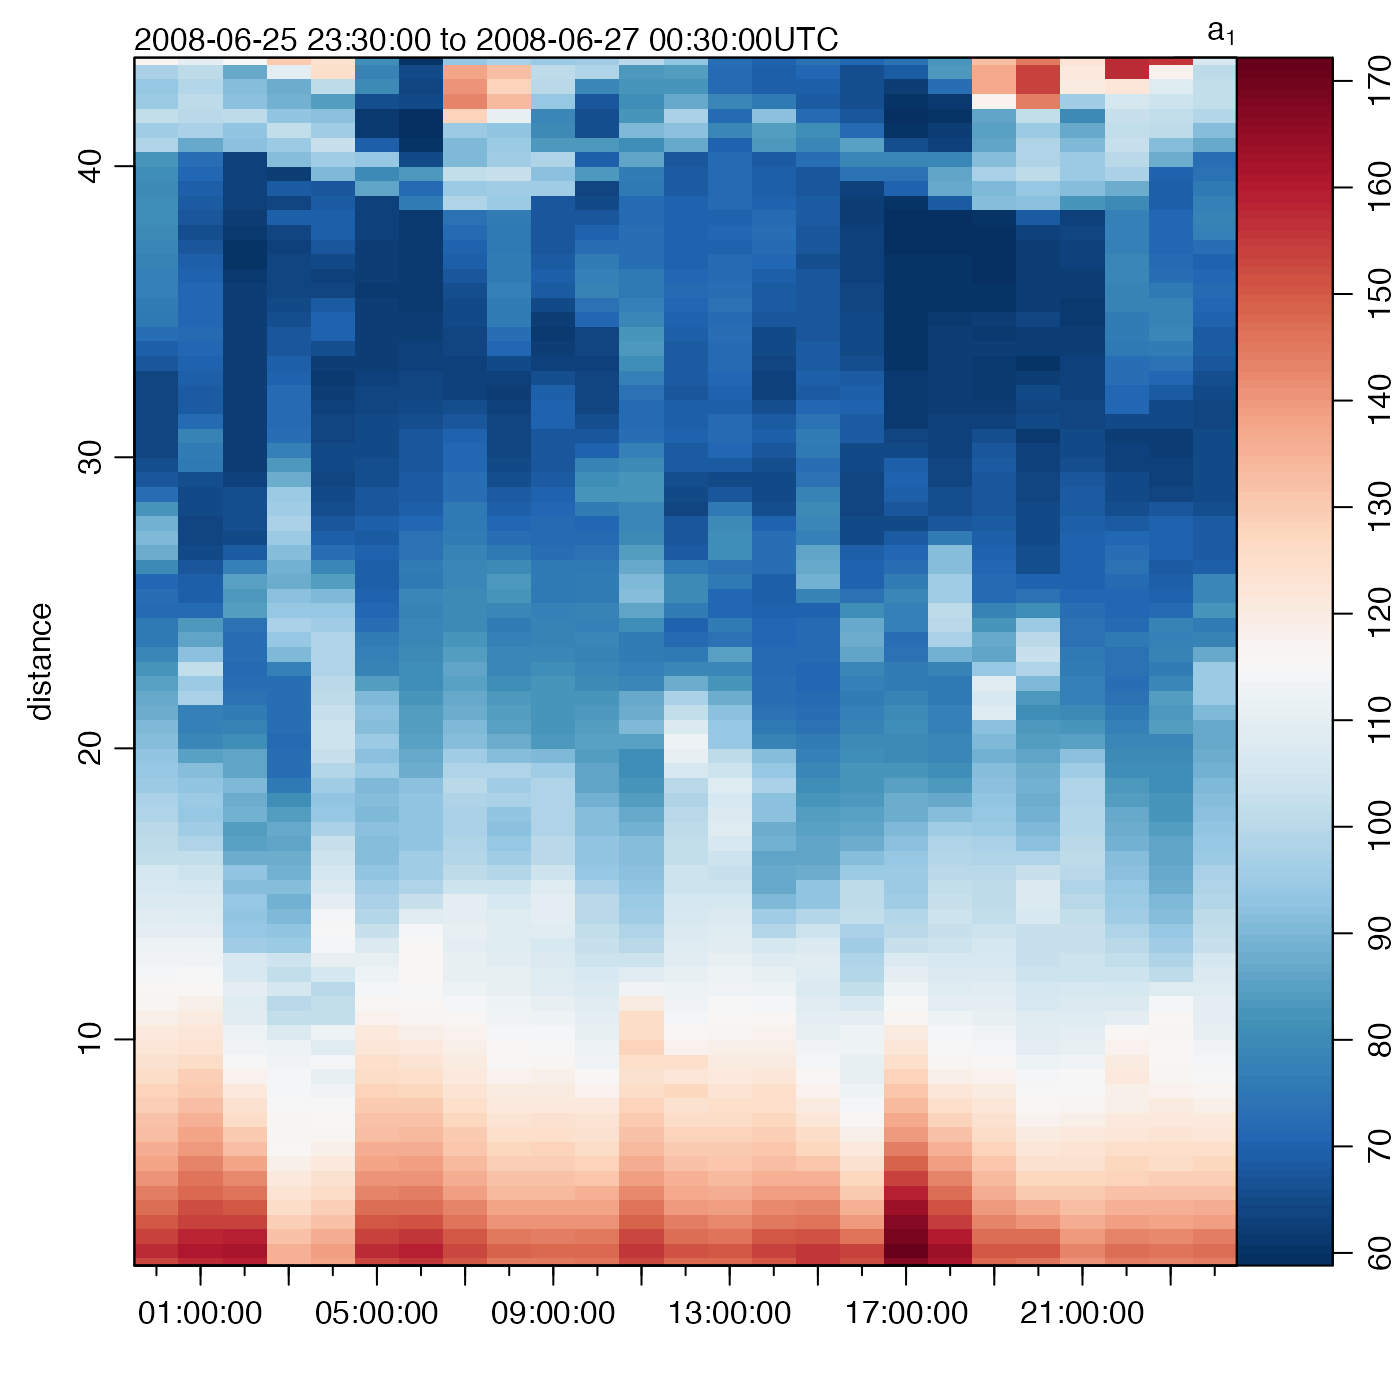 adp.att <- beamUnspreadAdp(adp)
plot(adp.att, which = 5) # beam 1 echo intensity
adp.att <- beamUnspreadAdp(adp)
plot(adp.att, which = 5) # beam 1 echo intensity
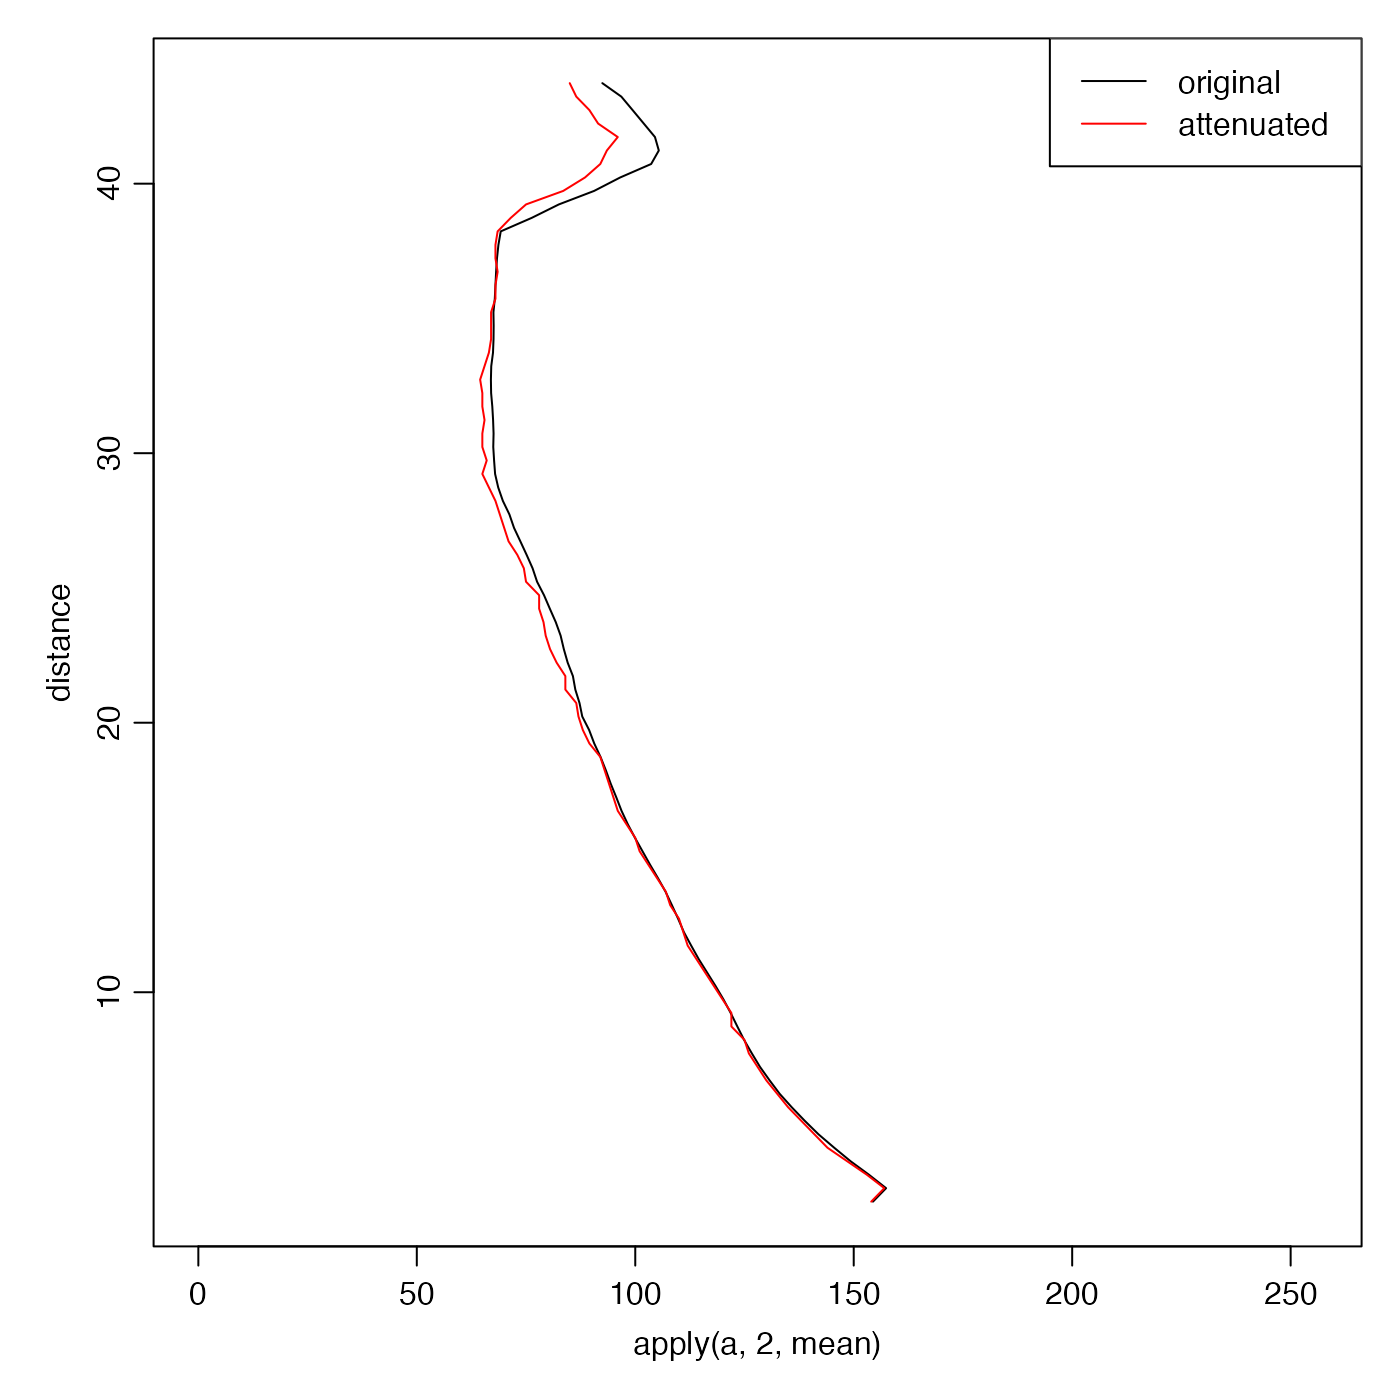
 # Profiles
par(mar = c(4, 4, 1, 1))
a <- adp[["a", "numeric"]] # second arg yields matrix return value
distance <- adp[["distance"]]
plot(apply(a, 2, mean), distance, type = "l", xlim = c(0, 256))
lines(apply(a, 2, median), distance, type = "l", col = "red")
legend("topright", lwd = 1, col = c("black", "red"), legend = c("original", "attenuated"))
# Profiles
par(mar = c(4, 4, 1, 1))
a <- adp[["a", "numeric"]] # second arg yields matrix return value
distance <- adp[["distance"]]
plot(apply(a, 2, mean), distance, type = "l", xlim = c(0, 256))
lines(apply(a, 2, median), distance, type = "l", col = "red")
legend("topright", lwd = 1, col = c("black", "red"), legend = c("original", "attenuated"))
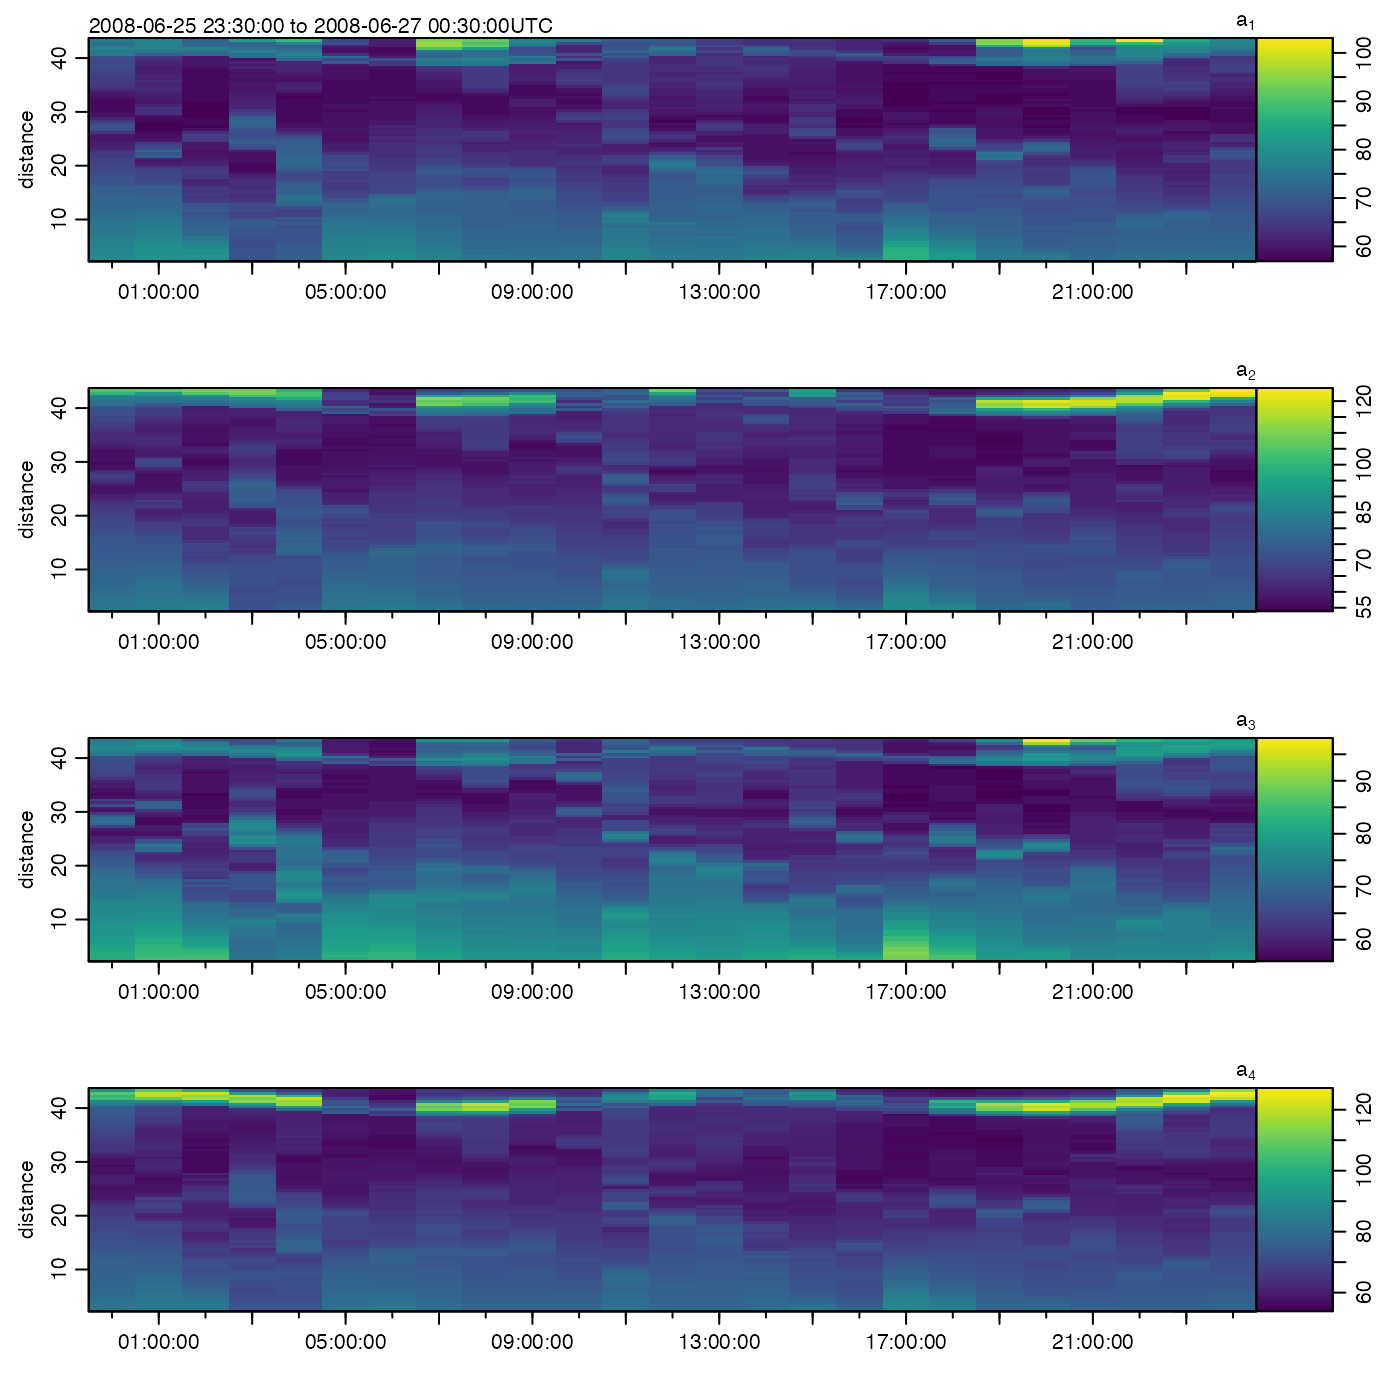
 # Image
plot(adp.att, which = "amplitude", col = oce.colorsViridis(100))
# Image
plot(adp.att, which = "amplitude", col = oce.colorsViridis(100))