Report statistics of ADP or ADV velocities, such as means and variance ellipses.
Arguments
Value
A list containing items the major and minor axes of the covariance
ellipse (ellipseMajor and ellipseMinor), the angle of the
major axis anticlockwise of the horizontal axis (ellipseAngle), and
the x and y components of the mean velocity (uMean and vMean).
See also
Other things related to adp data:
[[,adp-method,
[[<-,adp-method,
ad2cpCodeToName(),
ad2cpHeaderValue(),
adp,
adp-class,
adpAd2cpFileTrim(),
adpConvertRawToNumeric(),
adpEnsembleAverage(),
adpFlagPastBoundary(),
adpRdiFileTrim(),
adp_rdi.000,
applyMagneticDeclination,adp-method,
as.adp(),
beamName(),
beamToXyz(),
beamToXyzAdp(),
beamToXyzAdpAD2CP(),
beamToXyzAdv(),
beamUnspreadAdp(),
binmapAdp(),
enuToOther(),
enuToOtherAdp(),
handleFlags,adp-method,
is.ad2cp(),
plot,adp-method,
read.adp(),
read.adp.ad2cp(),
read.adp.nortek(),
read.adp.rdi(),
read.adp.sontek(),
read.adp.sontek.serial(),
read.aquadopp(),
read.aquadoppHR(),
read.aquadoppProfiler(),
rotateAboutZ(),
setFlags,adp-method,
subset,adp-method,
subtractBottomVelocity(),
summary,adp-method,
toEnu(),
toEnuAdp(),
xyzToEnu(),
xyzToEnuAdp(),
xyzToEnuAdpAD2CP()
Other things related to adv data:
[[,adv-method,
[[<-,adv-method,
adv,
adv-class,
advSontekAdrFileTrim(),
applyMagneticDeclination,adv-method,
beamName(),
beamToXyz(),
enuToOther(),
enuToOtherAdv(),
plot,adv-method,
read.adv(),
read.adv.nortek(),
read.adv.sontek.adr(),
read.adv.sontek.serial(),
read.adv.sontek.text(),
rotateAboutZ(),
subset,adv-method,
summary,adv-method,
toEnu(),
toEnuAdv(),
xyzToEnu(),
xyzToEnuAdv()
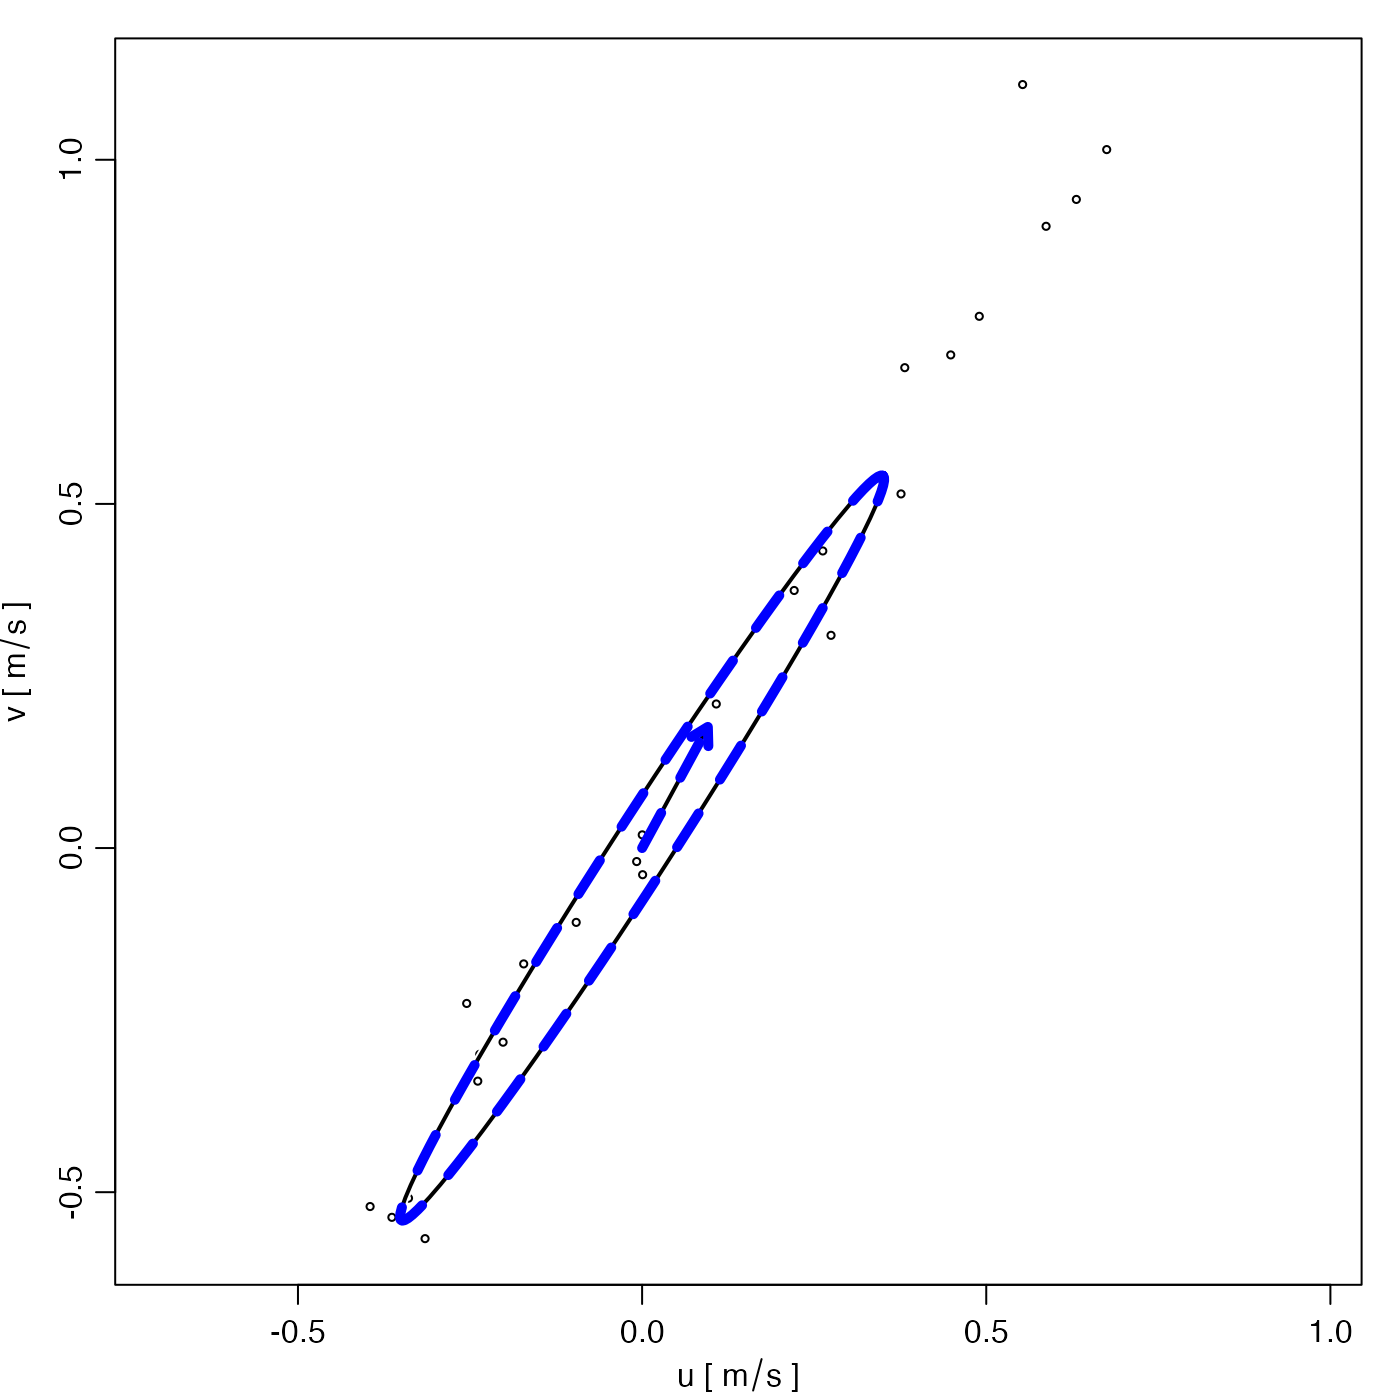
Examples
library(oce)
data(adp)
a <- velocityStatistics(adp)
print(a)
#> $ellipseMajor
#> [1] 0.6442399
#>
#> $ellipseMinor
#> [1] 0.04197328
#>
#> $ellipseAngle
#> [1] 57.09922
#>
#> $uMean
#> [1] 0.095503
#>
#> $vMean
#> [1] 0.1760109
#>
t <- seq(0, 2 * pi, length.out = 100)
theta <- a$ellipseAngle * pi / 180
y <- a$ellipseMajor * cos(t) * sin(theta) + a$ellipseMinor * sin(t) * cos(theta)
x <- a$ellipseMajor * cos(t) * cos(theta) - a$ellipseMinor * sin(t) * sin(theta)
plot(adp, which = "uv+ellipse+arrow")
lines(x, y, col = "blue", lty = "dashed", lwd = 5)
arrows(0, 0, a$uMean, a$vMean, lwd = 5, length = 1 / 10, col = "blue", lty = "dashed")