This function changes specified entries in the data-quality
flags of a adp object, which are stored within
a list named flags that resides in the metadata
slot. If the object already has a flag set up for name,
then only the specified entries are altered. If not, the flag
entry is first created and its entries set to default,
after which the entries specified by i
are changed to value.
The specification is made with i, the form of which
is determined by the data item in question. Generally,
the rules are as follows:
If the data item is a vector, then
imust be (a) an integer vector specifying indices to be set tovalue, (b) a logical vector of length matching the data item, withTRUEmeaning to set the flag tovalue, or (c) a function that takes anoceobject as its single argument, and returns a vector in either of the forms just described.If the data item is an array, then
imust be (a) a data frame of integers whose rows specify spots to change (where the number of columns matches the number of dimensions of the data item), (b) a logical array that has dimension equal to that of the data item, or (c) a function that takes anoceobject as its single input and returns such a data frame or array.
See “Details” for the particular case of adp objects.
Arguments
- object
An oce object.
- name
Character string indicating the name of the variable to be flagged. If this variable is not contained in the object's
dataslot, an error is reported.- i
Indication of where to insert the flags; see “Description” for general rules and “Details” for rules for adp objects.
- value
The value to be inserted in the flag.
- debug
Integer set to 0 for quiet action or to 1 for some debugging.
Details
The only flag that may be set is v, for the array holding velocity. See “Indexing rules”, noting that adp data are stored in 3D arrays; Example 1 shows using a data frame for i, while Example 2 shows using an array.
See also
Other functions relating to data-quality flags:
defaultFlags(),
handleFlags(),
handleFlags,adp-method,
handleFlags,argo-method,
handleFlags,ctd-method,
handleFlags,oce-method,
handleFlags,section-method,
initializeFlagScheme(),
initializeFlagScheme,ctd-method,
initializeFlagScheme,oce-method,
initializeFlagScheme,section-method,
initializeFlagSchemeInternal(),
initializeFlags(),
initializeFlags,adp-method,
initializeFlags,oce-method,
initializeFlagsInternal(),
setFlags(),
setFlags,ctd-method,
setFlags,oce-method
Other things related to adp data:
[[,adp-method,
[[<-,adp-method,
ad2cpCodeToName(),
ad2cpHeaderValue(),
adp,
adp-class,
adpAd2cpFileTrim(),
adpConvertRawToNumeric(),
adpEnsembleAverage(),
adpFlagPastBoundary(),
adpRdiFileTrim(),
adp_rdi.000,
applyMagneticDeclination,adp-method,
as.adp(),
beamName(),
beamToXyz(),
beamToXyzAdp(),
beamToXyzAdpAD2CP(),
beamToXyzAdv(),
beamUnspreadAdp(),
binmapAdp(),
enuToOther(),
enuToOtherAdp(),
handleFlags,adp-method,
is.ad2cp(),
plot,adp-method,
read.adp(),
read.adp.ad2cp(),
read.adp.nortek(),
read.adp.rdi(),
read.adp.sontek(),
read.adp.sontek.serial(),
read.aquadopp(),
read.aquadoppHR(),
read.aquadoppProfiler(),
rotateAboutZ(),
subset,adp-method,
subtractBottomVelocity(),
summary,adp-method,
toEnu(),
toEnuAdp(),
velocityStatistics(),
xyzToEnu(),
xyzToEnuAdp(),
xyzToEnuAdpAD2CP()
Examples
library(oce)
data(adp)

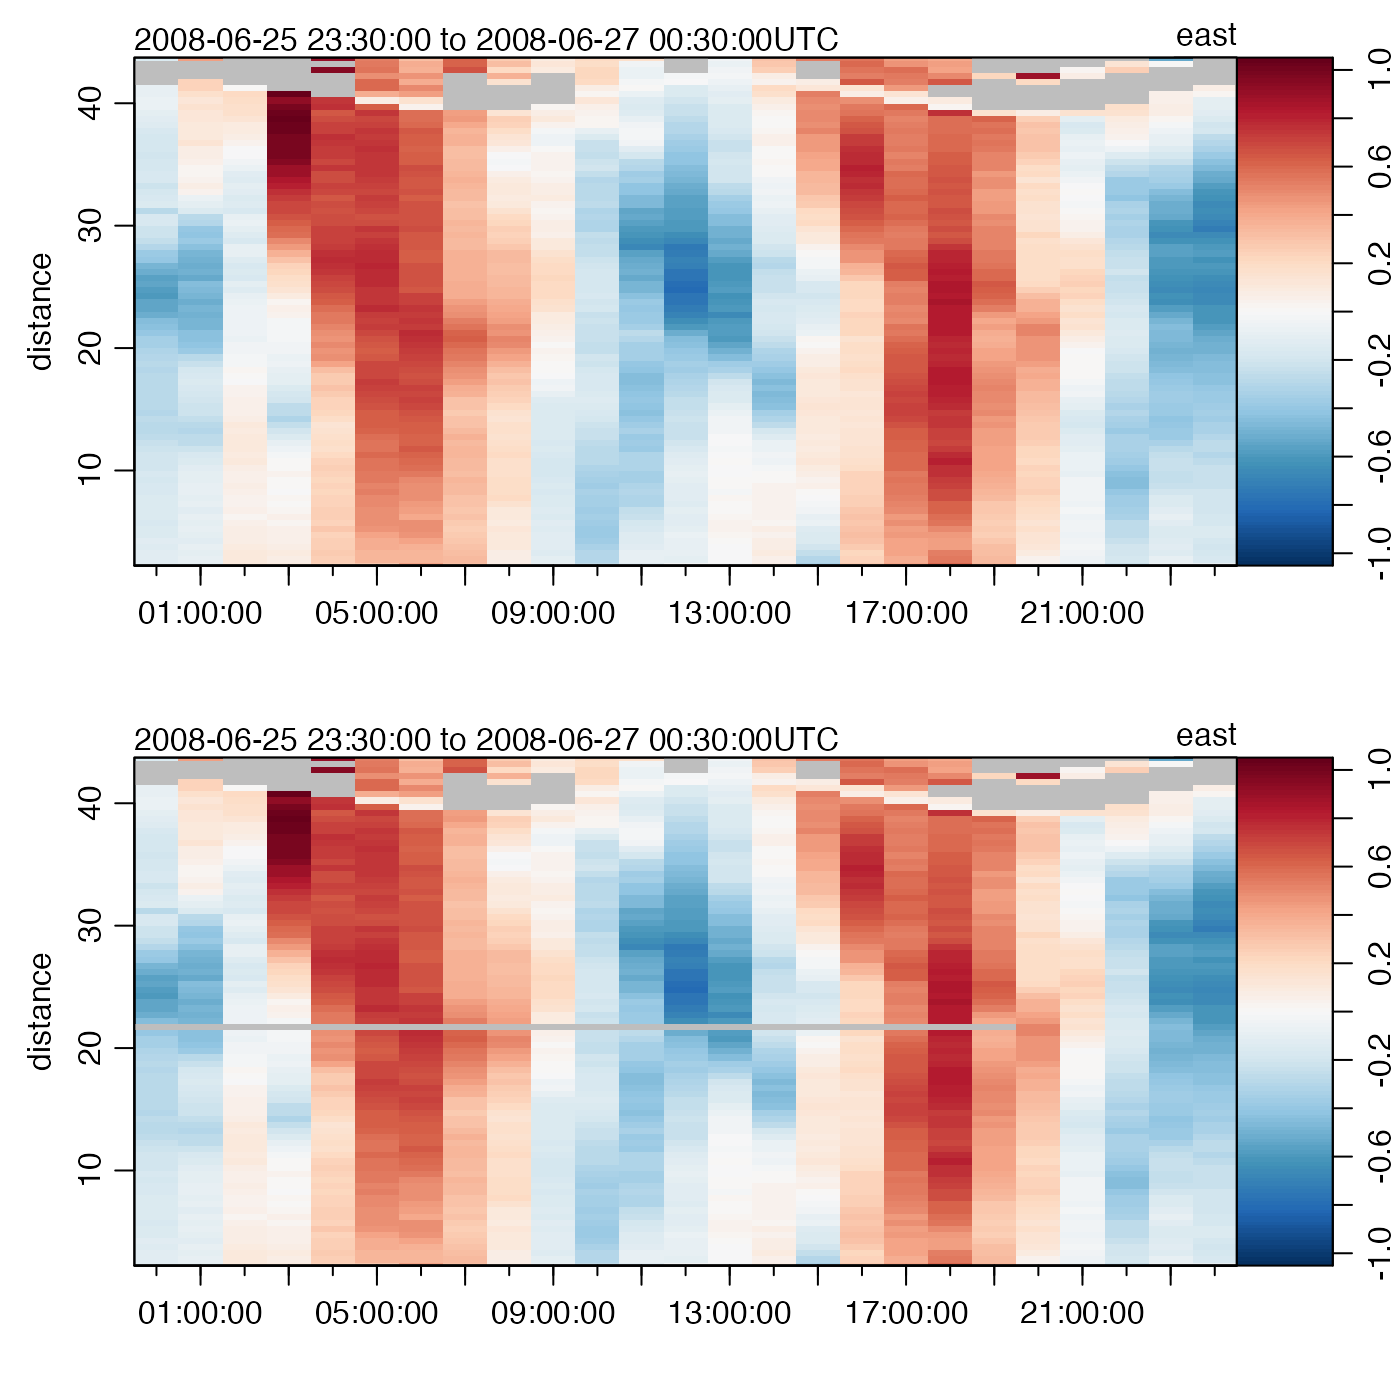
# Example 1: flag first 10 samples in a mid-depth bin of beam 1
i1 <- data.frame(1:20, 40, 1)
adpQC <- initializeFlags(adp, "v", 2)
adpQC <- setFlags(adpQC, "v", i1, 3)
adpClean1 <- handleFlags(adpQC, flags = list(3), actions = list("NA"))
par(mfrow = c(2, 1))
# Top: original, bottom: altered
plot(adp, which = "u1")
plot(adpClean1, which = "u1")


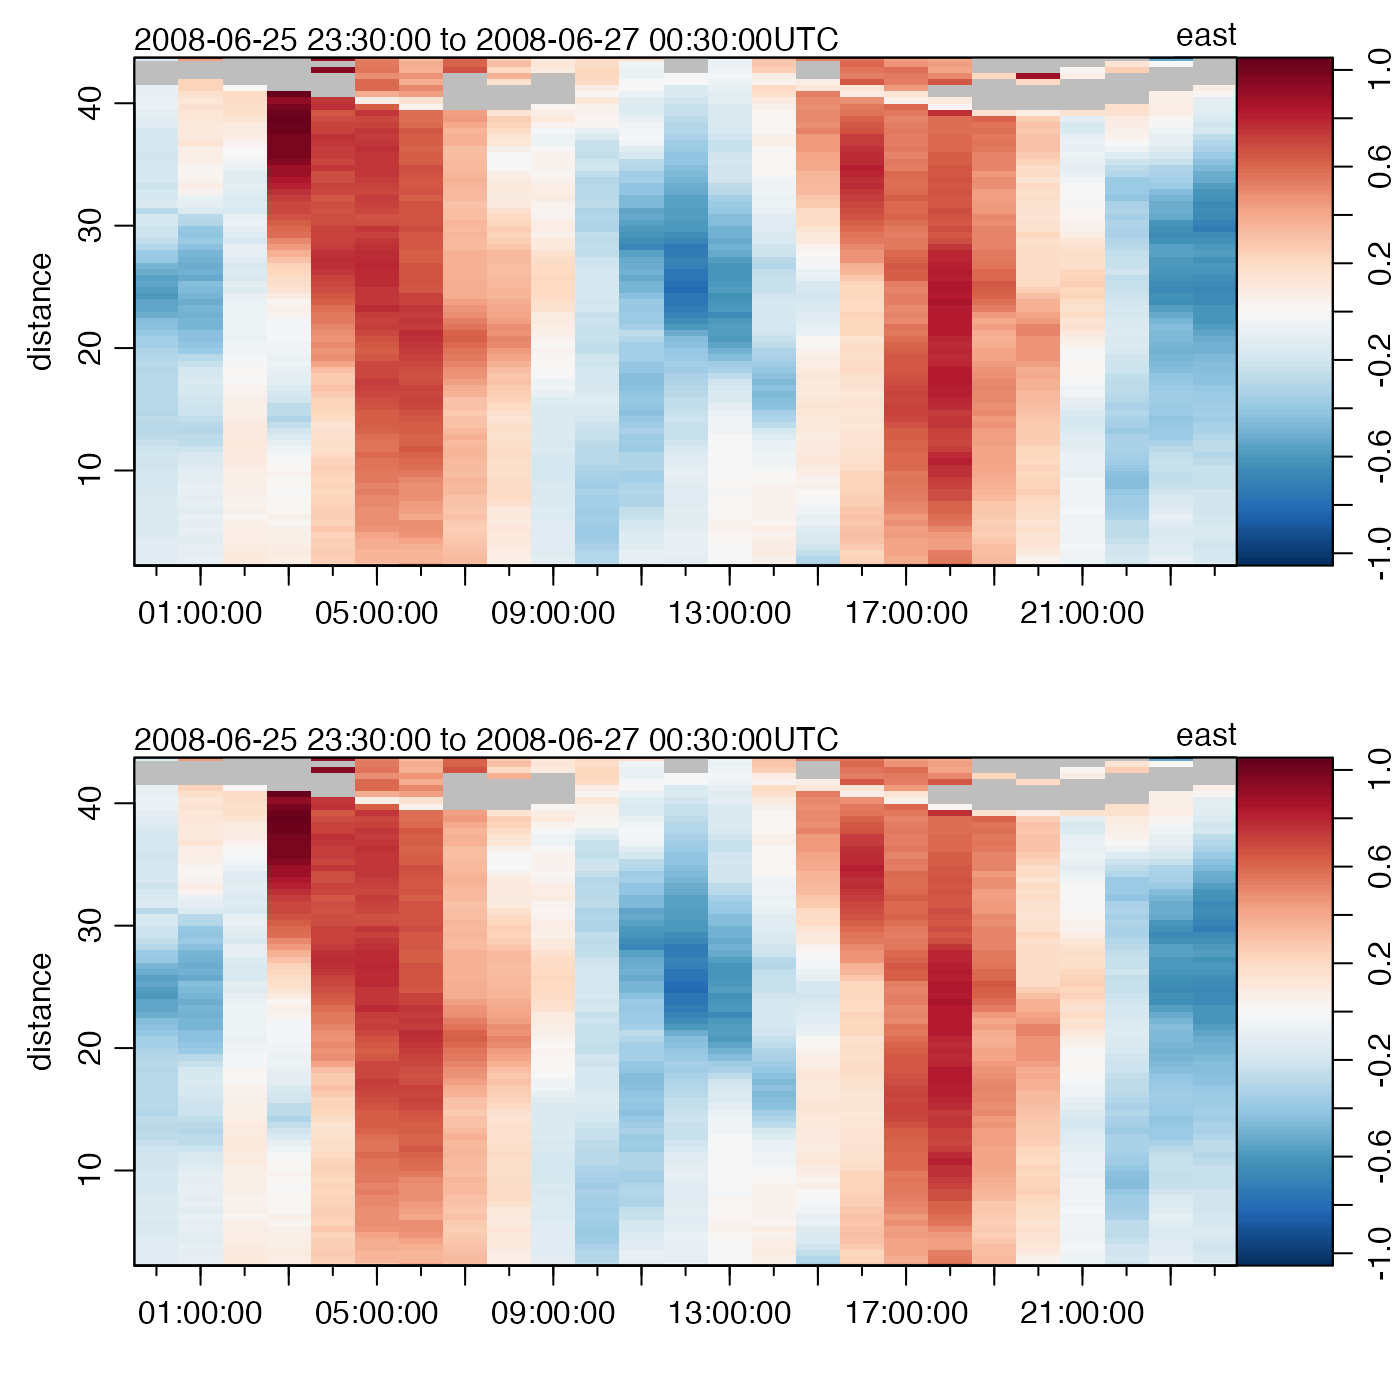
# Example 2: percent-good and error-beam scheme
v <- adp[["v"]]
i2 <- array(FALSE, dim = dim(v))
g <- adp[["g", "numeric"]]
# Thresholds on percent "goodness" and error "velocity"
G <- 25
V4 <- 0.45
for (k in 1:3) {
    i2[, , k] <- ((g[, , k] + g[, , 4]) < G) | (v[, , 4] > V4)
}
adpQC2 <- initializeFlags(adp, "v", 2)
adpQC2 <- setFlags(adpQC2, "v", i2, 3)
adpClean2 <- handleFlags(adpQC2, flags = list(3), actions = list("NA"))
# Top: original, bottom: altered
plot(adp, which = "u1")
plot(adpClean2, which = "u1") # differs at 8h and 20h
