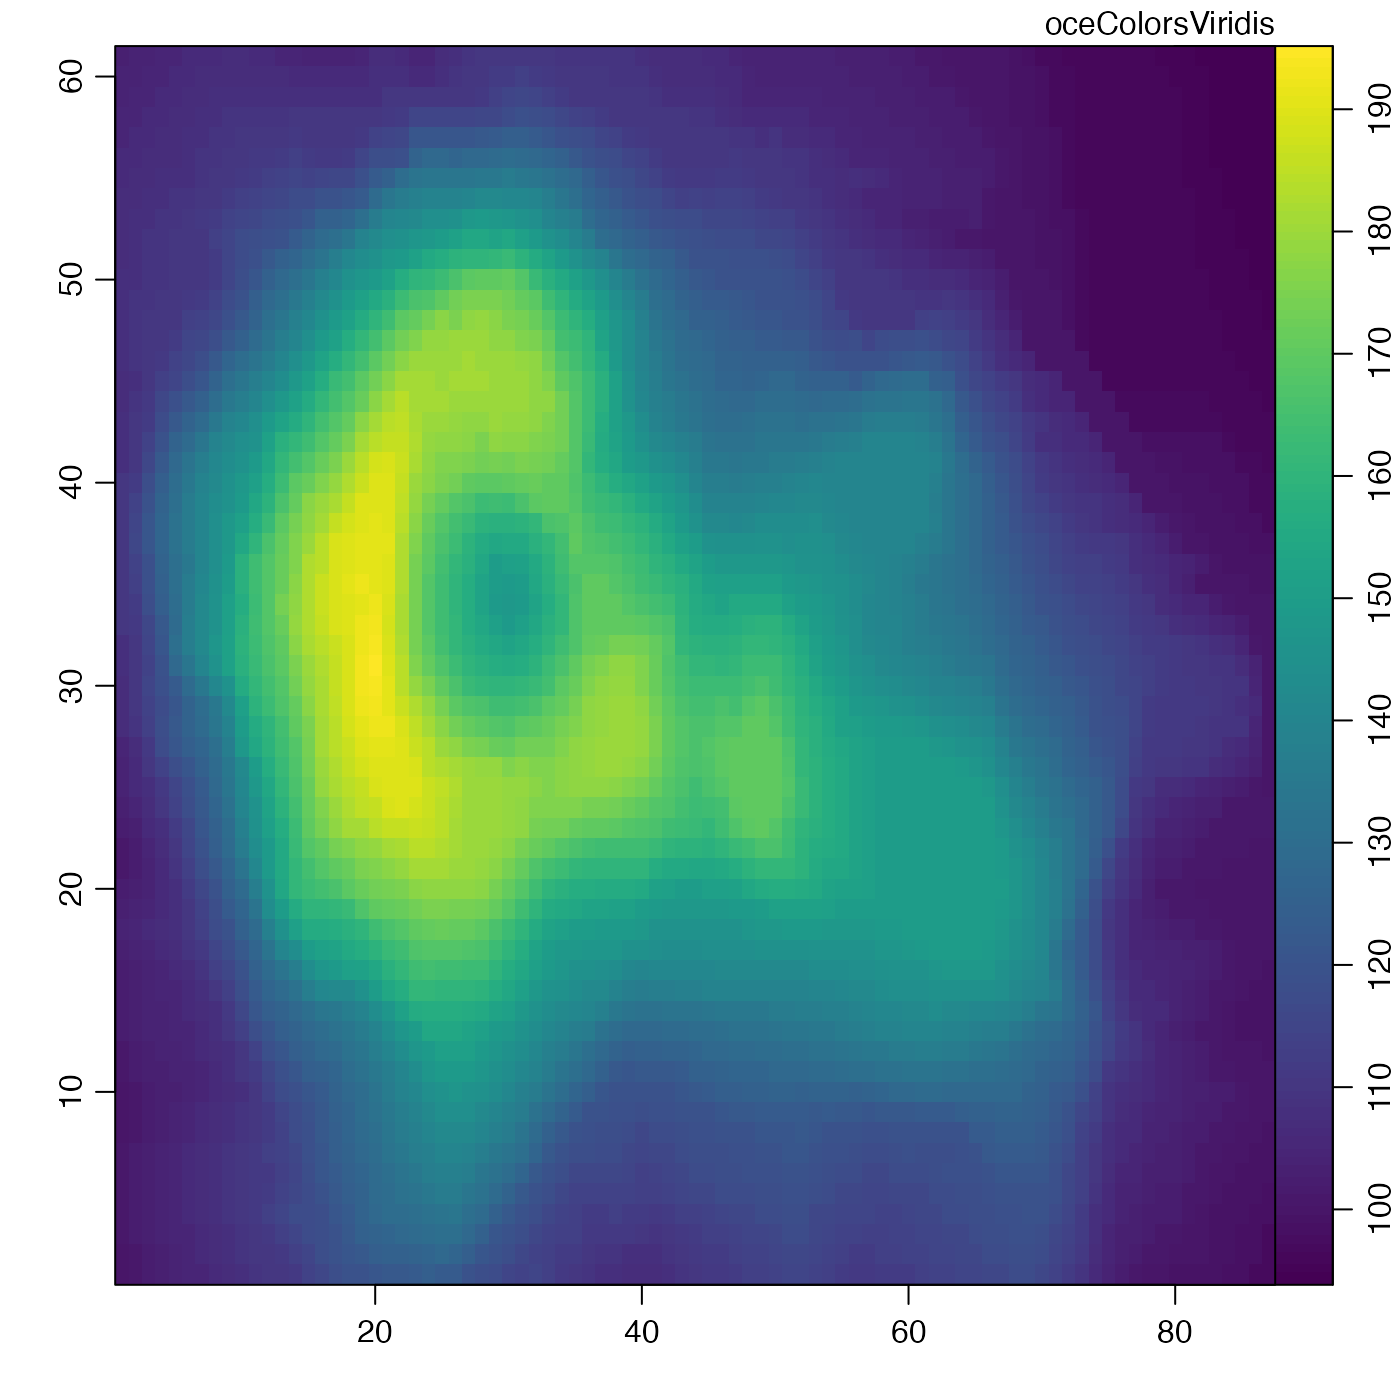
This is patterned on a matlab/python scheme that blends from yellow to blue in a way that is designed to reproduce well in black-and-white, and to be interpretable by those with certain forms of color blindness. See the references for notes about issues of colour blindness in computer graphics. An alternative to oceColorsViridis is provided in the viridis package, as illustrated in Example 2.
References
The following references provide information on choosing colour schemes, that are suitable for viewers who have colour deficiencies.
Light, Adam, and Patrick J. Bartlein. "The End of the Rainbow? Color Schemes for Improved Data Graphics." Eos, Transactions American Geophysical Union 85, no. 40 (2004): 385. DOI: 10.1029/2004EO400002
Stephenson, David B. "Comment on 'Color Schemes for Improved Data Graphics', by A Light and P.J. Bartlein." Eos, Transactions American Geophysical Union 86, no. 20 (2005): 196. DOI: 10.1029/2005EO200005
Light, Adam, and Patrick J. Bartlein. "Reply to 'Comment on Color Schemes for Improved Data Graphics,' by A. Light and P.J. Bartlein'." Eos, Transactions American Geophysical Union 86, no. 20 (2005): 196–196. DOI: 10.1029/2005EO200006
See also
Other things related to colors:
colormap(),
colormapGMT(),
oceColors9B(),
oceColorsCDOM(),
oceColorsChlorophyll(),
oceColorsClosure(),
oceColorsCubeHelix(),
oceColorsDensity(),
oceColorsFreesurface(),
oceColorsGebco(),
oceColorsJet(),
oceColorsOxygen(),
oceColorsPAR(),
oceColorsPalette(),
oceColorsPhase(),
oceColorsSalinity(),
oceColorsTemperature(),
oceColorsTurbidity(),
oceColorsTurbo(),
oceColorsTwo(),
oceColorsVelocity(),
oceColorsVorticity(),
ocecolors