Compute density ratio for a ctd object. An error (perhaps with some hints)
is issued for any other type of object.
Arguments
- ctd
an oce object that holds
salinity,temperature, andpressure. Ifeosis"gsw", then it must also holdlongitudeandlatitude.- sense
an indication of the sense of double diffusion under study and therefore of the definition of Rrho; see “Details”
- smoothingLength
ignored if
dfsupplied, but otherwise the latter is calculated as the number of data points, divided by the number within a depth interval ofsmoothingLengthmetres.- df
if given, this is provided to
smooth.spline().- eos
equation of state, either
"unesco"or"gsw".- debug
an integer specifying whether debugging information is to be printed during the processing. This is a general parameter that is used by many
ocefunctions. Generally, settingdebug=0turns off the printing, while higher values suggest that more information be printed. If one function calls another, it usually reduces the value ofdebugfirst, so that a user can often obtain deeper debugging by specifying higherdebugvalues.
Details
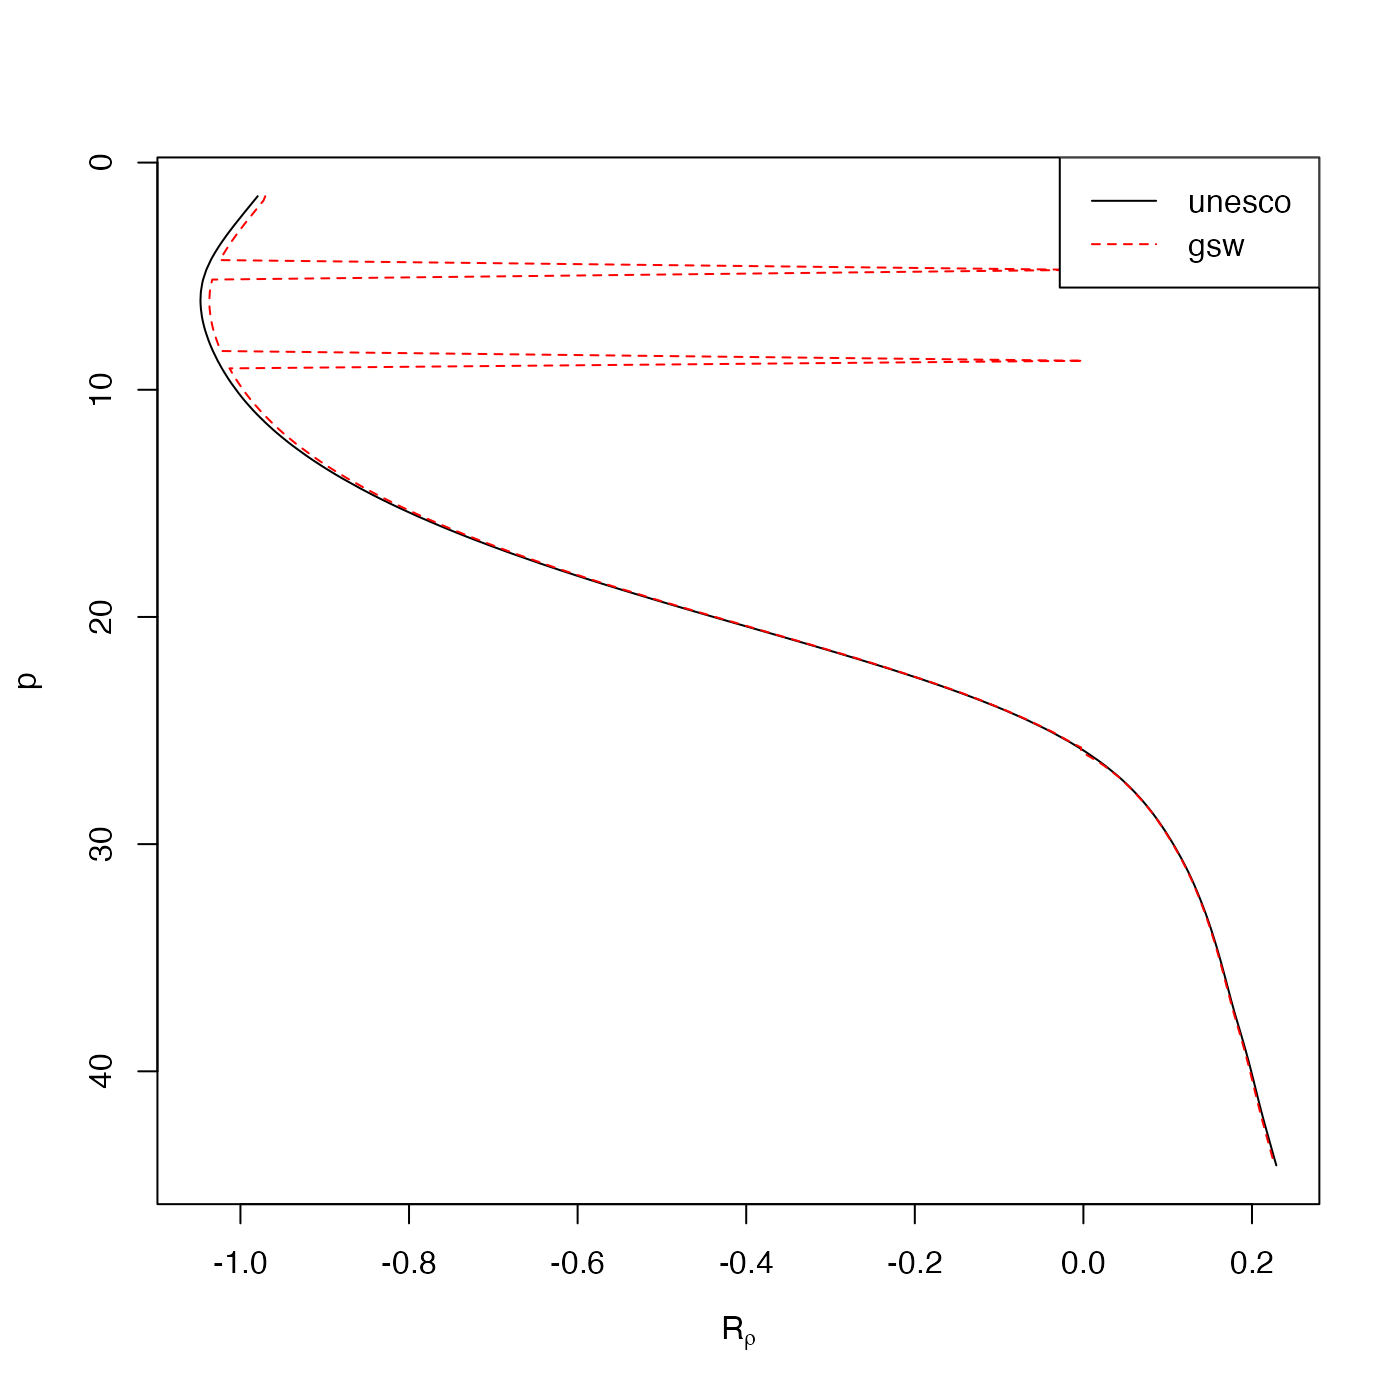
If eos="unesco", the work is done by calculating salinity and
potential-temperature derivatives from smoothing splines whose properties
are governed by smoothingLength or df. If
sense="diffusive" the definition is
\((beta*dS/dz)/(alpha*d(theta)/dz)\) and
the reciprocal for "finger".
If eos="gsw", the work is done by extracting absolute salinity and
conservative temperature, smoothing with a smoothing spline as in the
"unesco" case, and then calling gsw::gsw_Turner_Rsubrho()
on these smoothed fields. Since the gsw function works on mid-point
pressures, approx() is used to interpolate back to the original
pressures.
If the default arguments are acceptable, ctd[["Rrho"]] may be used
instead of swRrho(ctd).
See also
Other functions that calculate seawater properties:
T68fromT90(),
T90fromT48(),
T90fromT68(),
computableWaterProperties(),
locationForGsw(),
swAbsoluteSalinity(),
swAlpha(),
swAlphaOverBeta(),
swBeta(),
swCSTp(),
swConservativeTemperature(),
swDepth(),
swDynamicHeight(),
swLapseRate(),
swN2(),
swPressure(),
swRho(),
swSCTp(),
swSR(),
swSTrho(),
swSigma(),
swSigma0(),
swSigma1(),
swSigma2(),
swSigma3(),
swSigma4(),
swSigmaT(),
swSigmaTheta(),
swSoundAbsorption(),
swSoundSpeed(),
swSpecificHeat(),
swSpice(),
swSpiciness0(),
swSpiciness1(),
swSpiciness2(),
swSstar(),
swTFreeze(),
swTSrho(),
swThermalConductivity(),
swTheta(),
swViscosity(),
swZ()