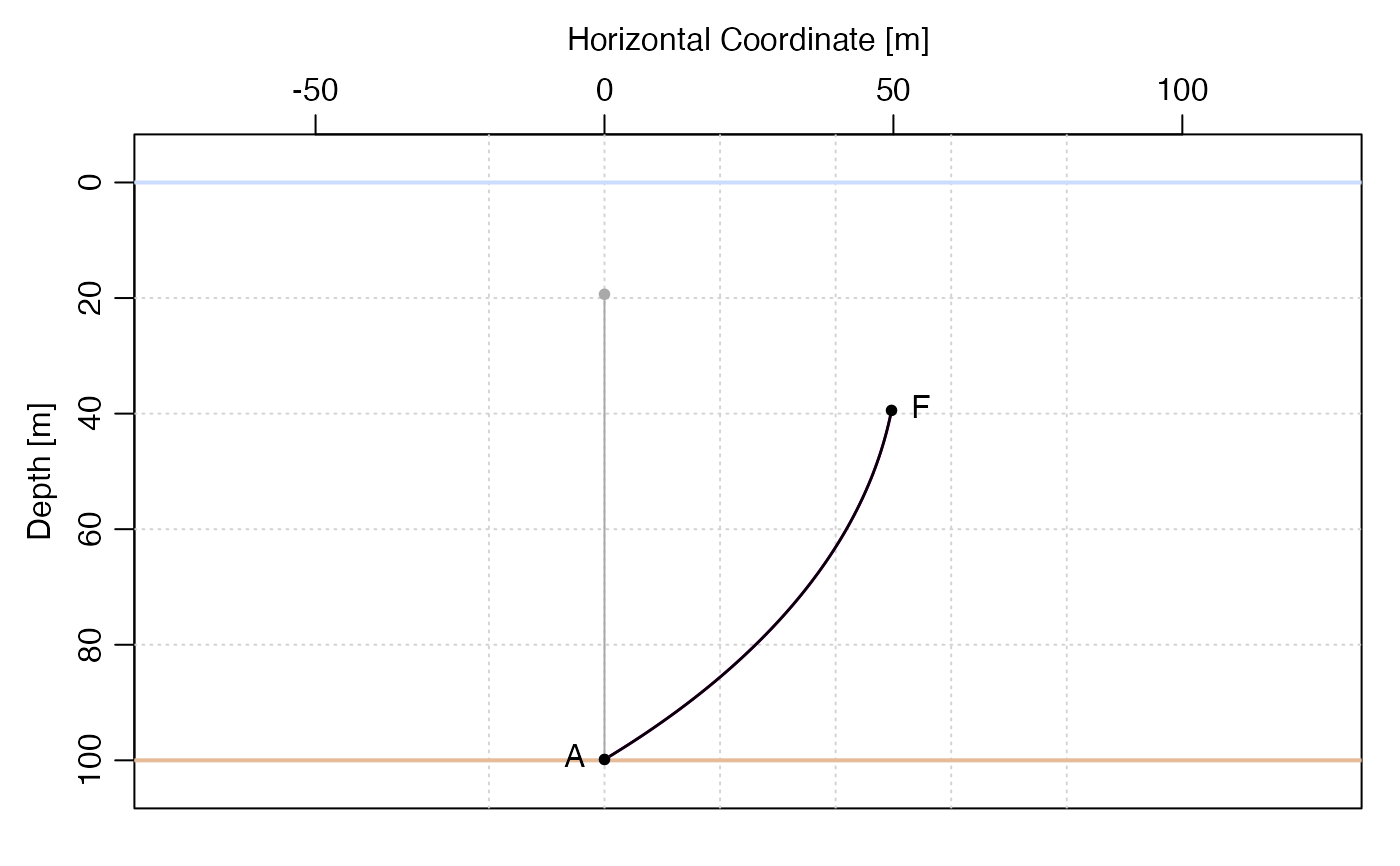
Plot a side-view diagram that indicates mooring geometry.
Arguments
- x
a
mooringobject, created withmooring().- which
character value indicating the desired plot, with choices:
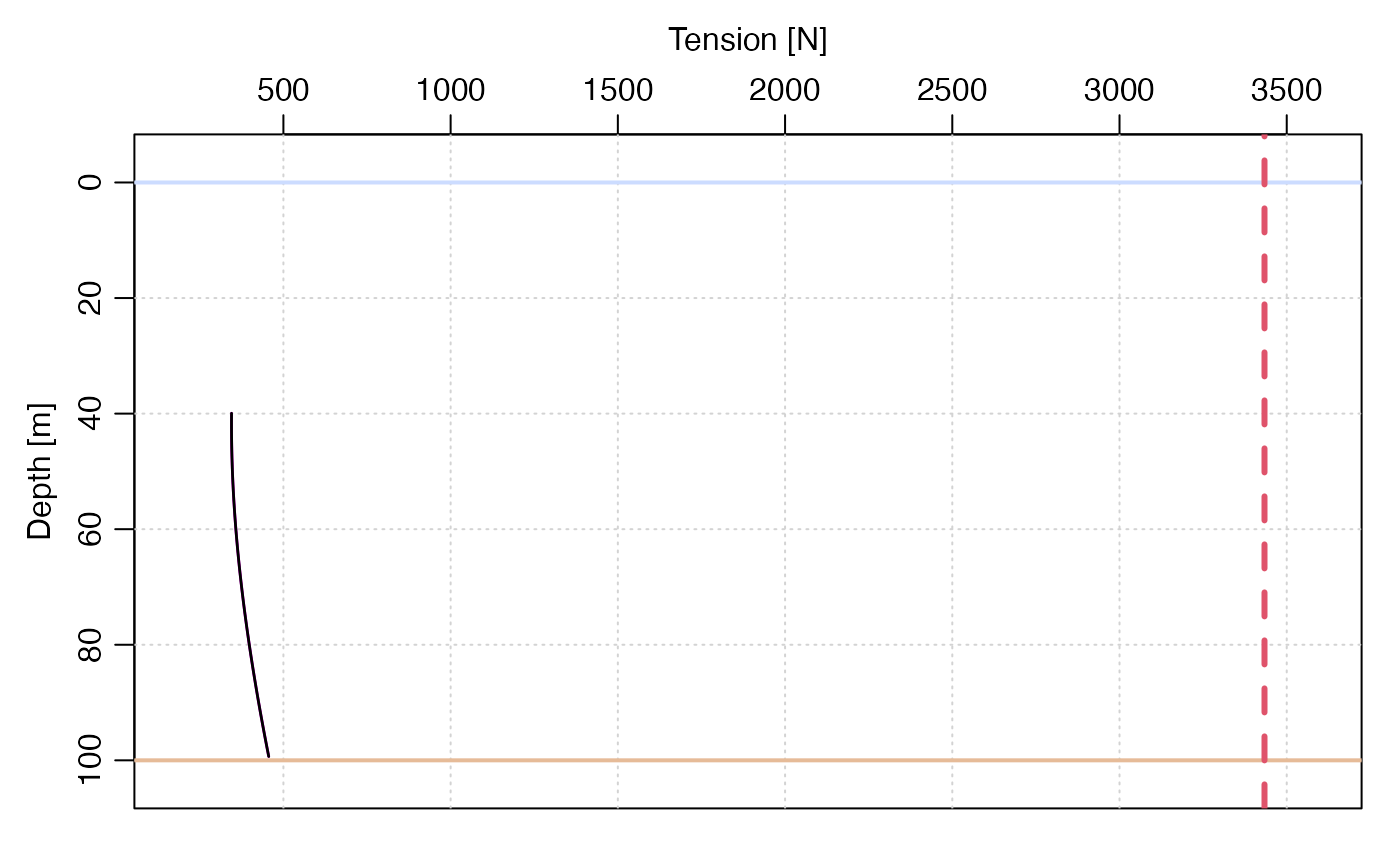
"shape"(the default),"knockdown","tension"and"velocity".- showInterfaces
logical value indicating whether to indicate the water surface with a blue line and the ocean bottom with a brown line.
- showDepths
logical value indicating whether to indicate the depths of floats, to the left of the symbols.
- showLabels
logical value indicating whether to indicate anchors, instruments and floats with
A,IandF, respectively.- showDetails
logical value indicating whether to show details for anchors, instruments and floats with text.
- fancy
logical value indicating whether to indicate the water and sediments with filled rectangles. The alternative is a simpler plot.
- title
character value indicating a title to put above the plot.
- mar
numeric vector of length 4, used to set margins outside axes. The default values reduce whitespace. See
par().- mgp
numeric vector of length 3, with a default that reduces axis whitespace. See
par().- xaxs, yaxs
character values that control axis ranges. See
par().- xlim
optional numeric vector of length 2 that can be used to specify the limits of the horizontal axis.
- type
character value indicating type of plot. The default,
"l", means to draw lines, while e.g."p"means to draw points.- debug
an integer value (or a numeric that can be converted to an integer) that controls debugging. If this is positive, then some debugging information may be printed by the function.
- ...
ignored