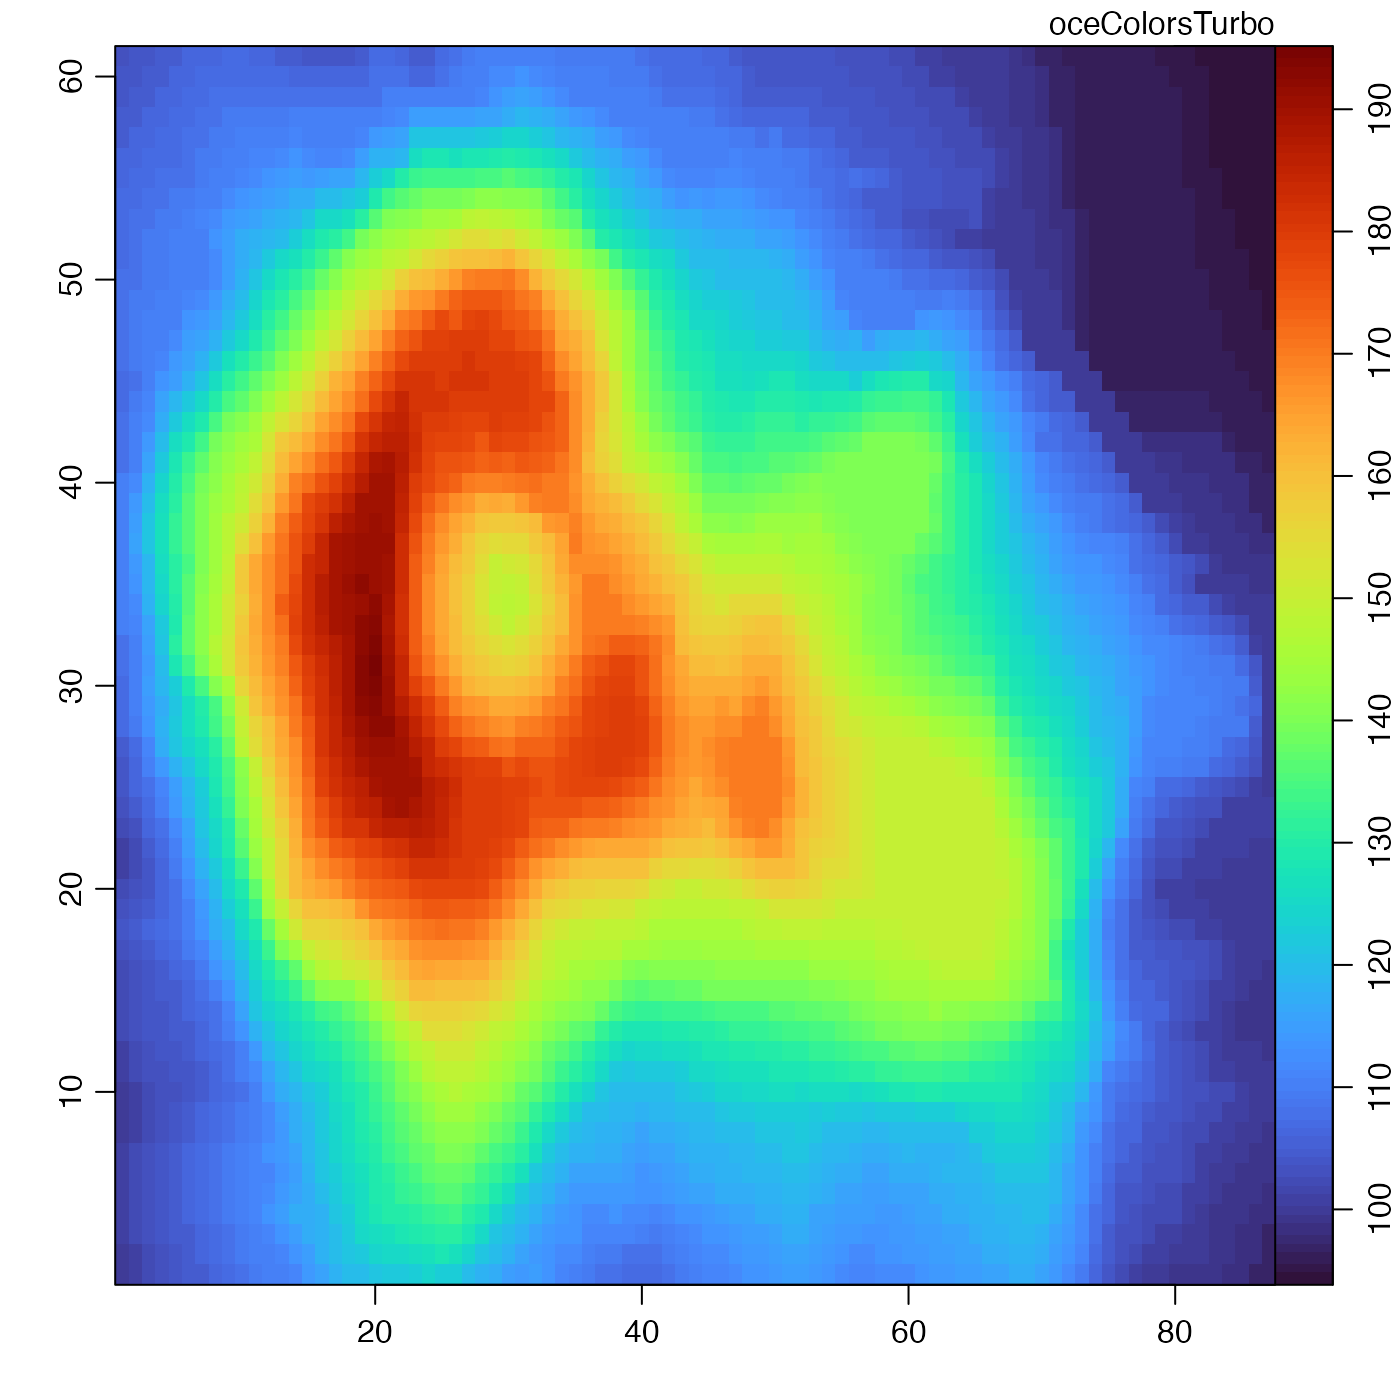
This uses the coefficients published (with Apache license) by google, as described by Mikhailo (2019).
References
Mikhailo, Anton.
“Turbo, An Improved Rainbow Colormap for Visualization.”
Google AI (blog), August 20, 2019.
https://ai.googleblog.com/2019/08/turbo-improved-rainbow-colormap-for.html
The following references provide information on choosing colour schemes, that are suitable for viewers who have colour deficiencies.
Light, Adam, and Patrick J. Bartlein. "The End of the Rainbow? Color Schemes for Improved Data Graphics." Eos, Transactions American Geophysical Union 85, no. 40 (2004): 385. DOI: 10.1029/2004EO400002
Stephenson, David B. "Comment on 'Color Schemes for Improved Data Graphics', by A Light and P.J. Bartlein." Eos, Transactions American Geophysical Union 86, no. 20 (2005): 196. DOI: 10.1029/2005EO200005
Light, Adam, and Patrick J. Bartlein. "Reply to 'Comment on Color Schemes for Improved Data Graphics,' by A. Light and P.J. Bartlein'." Eos, Transactions American Geophysical Union 86, no. 20 (2005): 196–196. DOI: 10.1029/2005EO200006
See also
Other things related to colors:
colormap(),
colormapGMT(),
oceColors9B(),
oceColorsCDOM(),
oceColorsChlorophyll(),
oceColorsClosure(),
oceColorsCubeHelix(),
oceColorsDensity(),
oceColorsFreesurface(),
oceColorsGebco(),
oceColorsJet(),
oceColorsOxygen(),
oceColorsPAR(),
oceColorsPalette(),
oceColorsPhase(),
oceColorsSalinity(),
oceColorsTemperature(),
oceColorsTurbidity(),
oceColorsTwo(),
oceColorsVelocity(),
oceColorsViridis(),
oceColorsVorticity(),
ocecolors