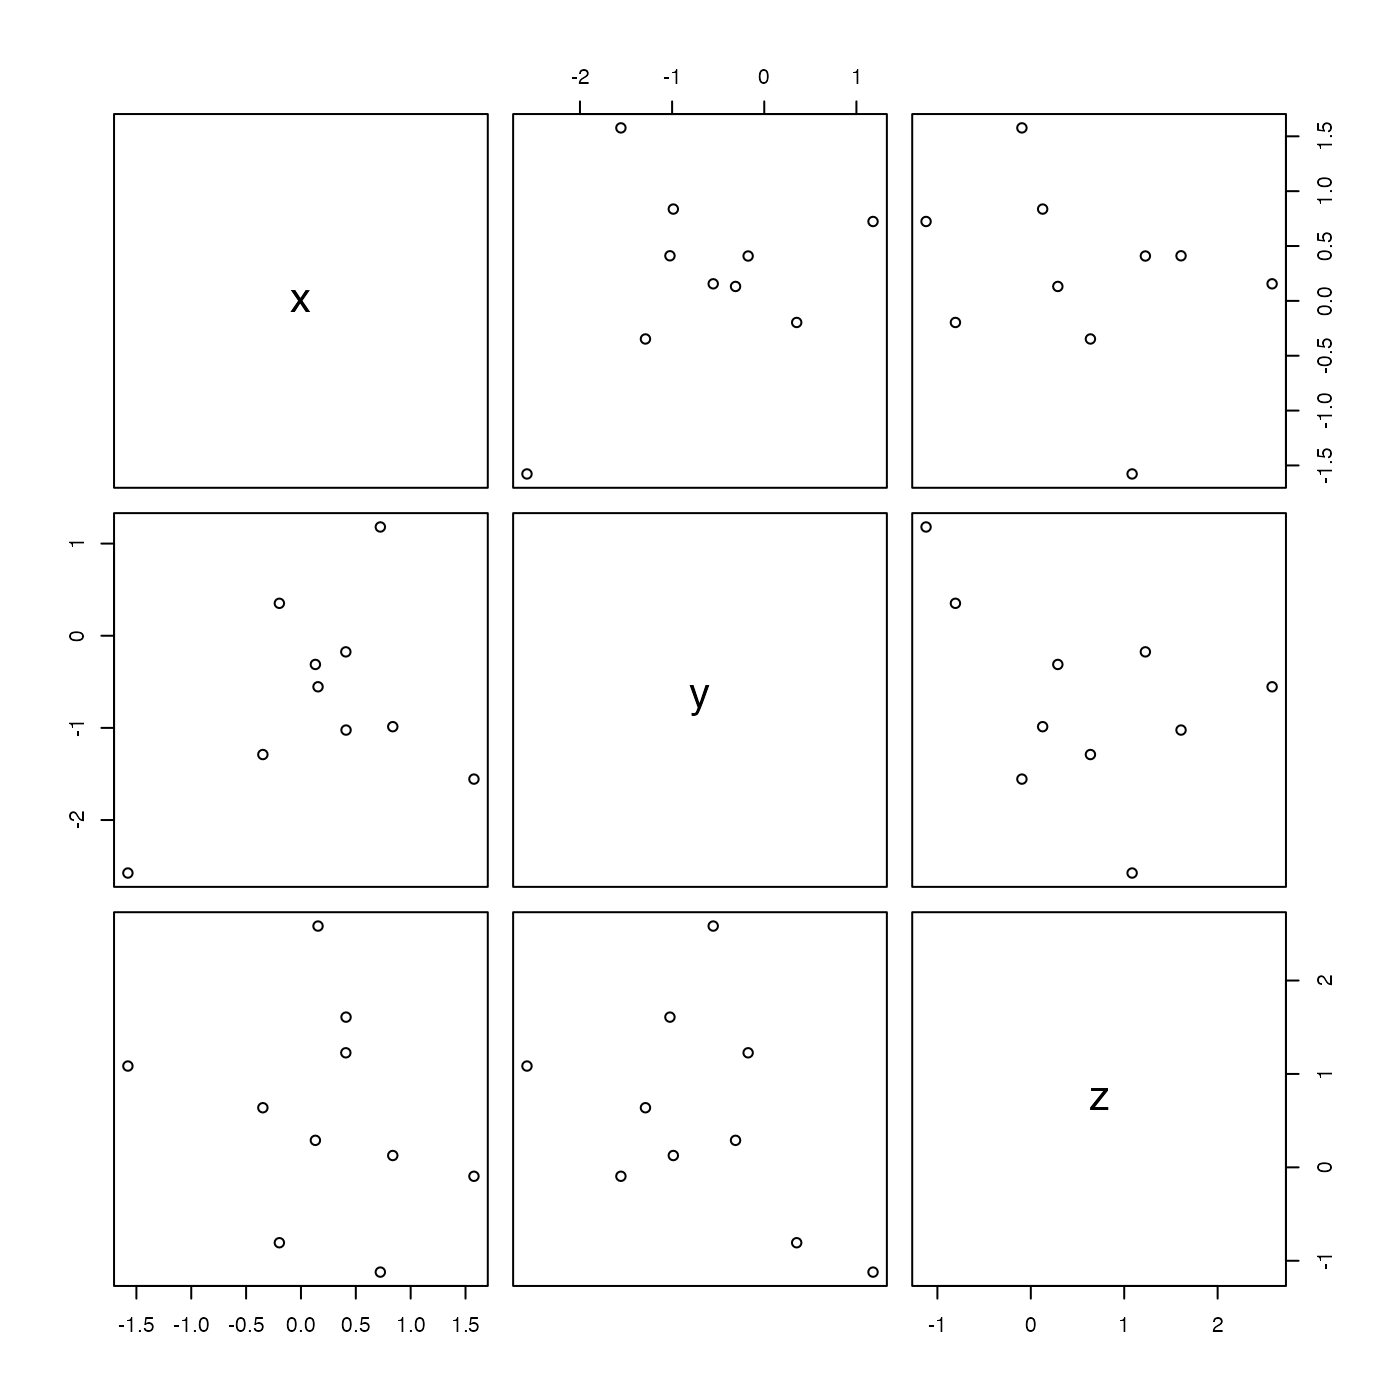
This creates a pairs() plot of the elements in the data
slot, if there are more than 2 elements there, or a simple xy plot if 2
elements, or a histogram if 1 element.
Usage
# S4 method for class 'oce'
plot(x, y, ...)
Arguments
- x
a basic oce object, but not from any subclass that derive from this base, because subclasses have their own plot methods, e.g. calling
plot()on a ctd object dispatches toplot,ctd-method().- y
Ignored; only present here because S4 object for generic
plotneed to have a second parameter before the...parameter.- ...
Passed to
hist(),plot(), or topairs(), according to whichever does the plotting.
Examples
library(oce)
o <- new("oce")
o <- oceSetData(o, "x", rnorm(10))
o <- oceSetData(o, "y", rnorm(10))
o <- oceSetData(o, "z", rnorm(10))
plot(o)