In the normal use, drawPalette() draws an image palette near the
right-hand side of the plotting device, and then adjusts the global margin
settings in such a way as to cause the next plot to appear (with much larger
width) to the left of the palette. The function can also be used, if
zlim is not provided, to adjust the margin without drawing anything;
this is useful in lining up the x axes of a stack of plots, some some of
which will have palettes and others not.
Arguments
- zlim
two-element vector containing the lower and upper limits of z. This may also be a vector of any length exceeding 1, in which case its range is used.
- zlab
label for the palette scale.
- breaks
optional numeric vector of the z values for breaks in the color scheme. If
colormapis provided, it takes precedence overbreaksandcol.- col
optional argument, either a vector of colors corresponding to the breaks, of length 1 less than the number of breaks, or a function specifying colors. If
colis not provided, and ifcolormapis also not provided, thencoldefaults tooceColorsViridis(). Ifcolormapis provided, it takes precedence overbreaksandcol.- colormap
an optional color map as created by
colormap(). Ifcolormapis provided, it takes precedence overbreaksandcol.- mai
margins for palette, as defined in the usual way; see
par(). If not given, reasonable values are inferred from the existence of a non-blankzlab.- cex
numeric character expansion value for text labels
- pos
an integer indicating the location of the palette within the plotting area, 1 for near the bottom, 2 for near the left-hand side, 3 for near the top side, and 4 (the default) for near the right-hand side.
- las
optional argument, passed to
axis(), to control the orientation of numbers along the axis. As explained in the help forpar(), the meaning oflasis as follows:las=0(the default) means to put labels parallel to the axis,las=1means horizontal (regardless of axis orientation),las=2means perpendicular to the axis, andlas=3means to vertical (regardless of axis orientation). Note that the automatic computation of margin spacing parametermaiassumes thatlas=0, and so for other cases, the user may need to specify themaiargument directly.- labels
optional vector of labels for ticks on palette axis (must correspond with
at)- at
optional vector of positions for the
labels- levels
optional contour levels, in preference to
breaksvalues, to be added to the image ifdrawContoursisTRUE.- drawContours
logical value indicating whether to draw contours on the palette, at the color breaks.
- plot
logical value indicating whether to plot the palette, the default, or whether to just alter the margins to make space for where the palette would have gone. The latter case may be useful in lining up plots, as in example 1 of “Examples”.
- fullpage
logical value indicating whether to draw the palette filling the whole plot width (apart from
mai, of course). This can be helpful if the palette panel is to be created withlayout(), as illustrated in the “Examples”.- drawTriangles
logical value indicating whether to draw triangles on the top and bottom of the palette. If a single value is provided, it applies to both ends of the palette. If a pair is provided, the first refers to the lower range of the palette, and the second to the upper range.
- axisPalette
optional replacement function for
axis(), e.g. for exponential notation on large or small values.- tformat
optional format for axis labels, if the variable is a time type (ignored otherwise).
- debug
a flag that turns on debugging. Set to 1 to get a moderate amount of debugging information, or to 2 to get more.
- ...
optional arguments passed to plotting functions.
Details
The plot positioning is done entirely with margins, not with
par(mfrow) or other R schemes for multi-panel plots. This means that
the user is free to use those schemes without worrying about nesting or
conflicts.
Use with multi-panel plots
An important consequence of the margin
adjustment is that multi-panel plots require that the initial margin be
stored prior to the first call to drawPalette(), and reset after each
palette-plot pair. This method is illustrated in “Examples”.
See also
This is used by imagep().
Examples
library(oce)
par(mgp = getOption("oceMgp"))
# 1. A three-panel plot
par(mfrow = c(3, 1), mar = c(3, 3, 1, 1))
omar <- par("mar") # save initial margin
# 1a. top panel: simple case with Viridis scheme
drawPalette(zlim = c(0, 1), col = oce.colorsViridis(10))
plot(1:10, 1:10, col = oce.colorsViridis(10)[1:10], pch = 20, cex = 3, xlab = "x", ylab = "y")
par(mar = omar) # reset margin
# 1b. middle panel: colormap
cm <- colormap(name = "gmt_globe")
drawPalette(colormap = cm)
icol <- seq_along(cm$col)
plot(icol, cm$breaks[icol],
pch = 20, cex = 2, col = cm$col,
xlab = "Palette index", ylab = "Palette breaks"
)
par(mar = omar) # reset margin
# 1c. bottom panel: space for palette (to line up graphs)
drawPalette(plot = FALSE)
plot(1:10, 1:10, col = oce.colorsViridis(10)[1:10], pch = 20, cex = 3, xlab = "x", ylab = "y")
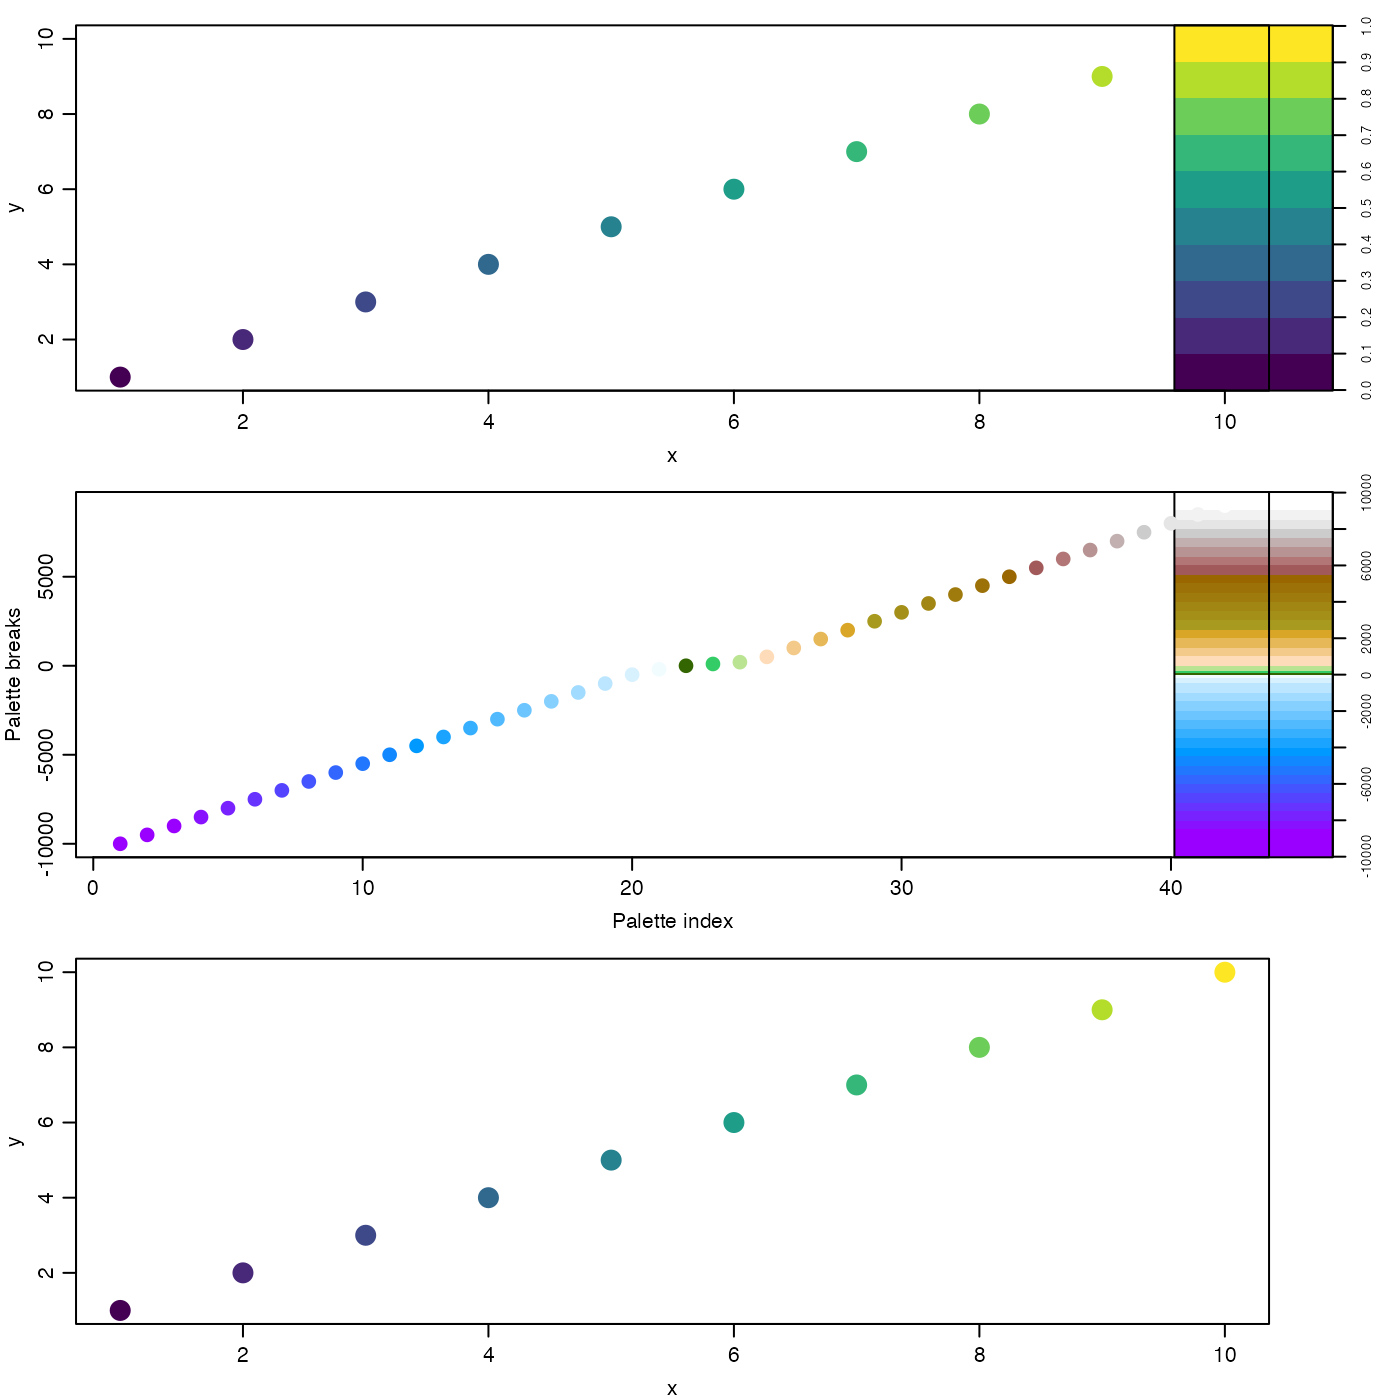 par(mar = omar) # reset margin
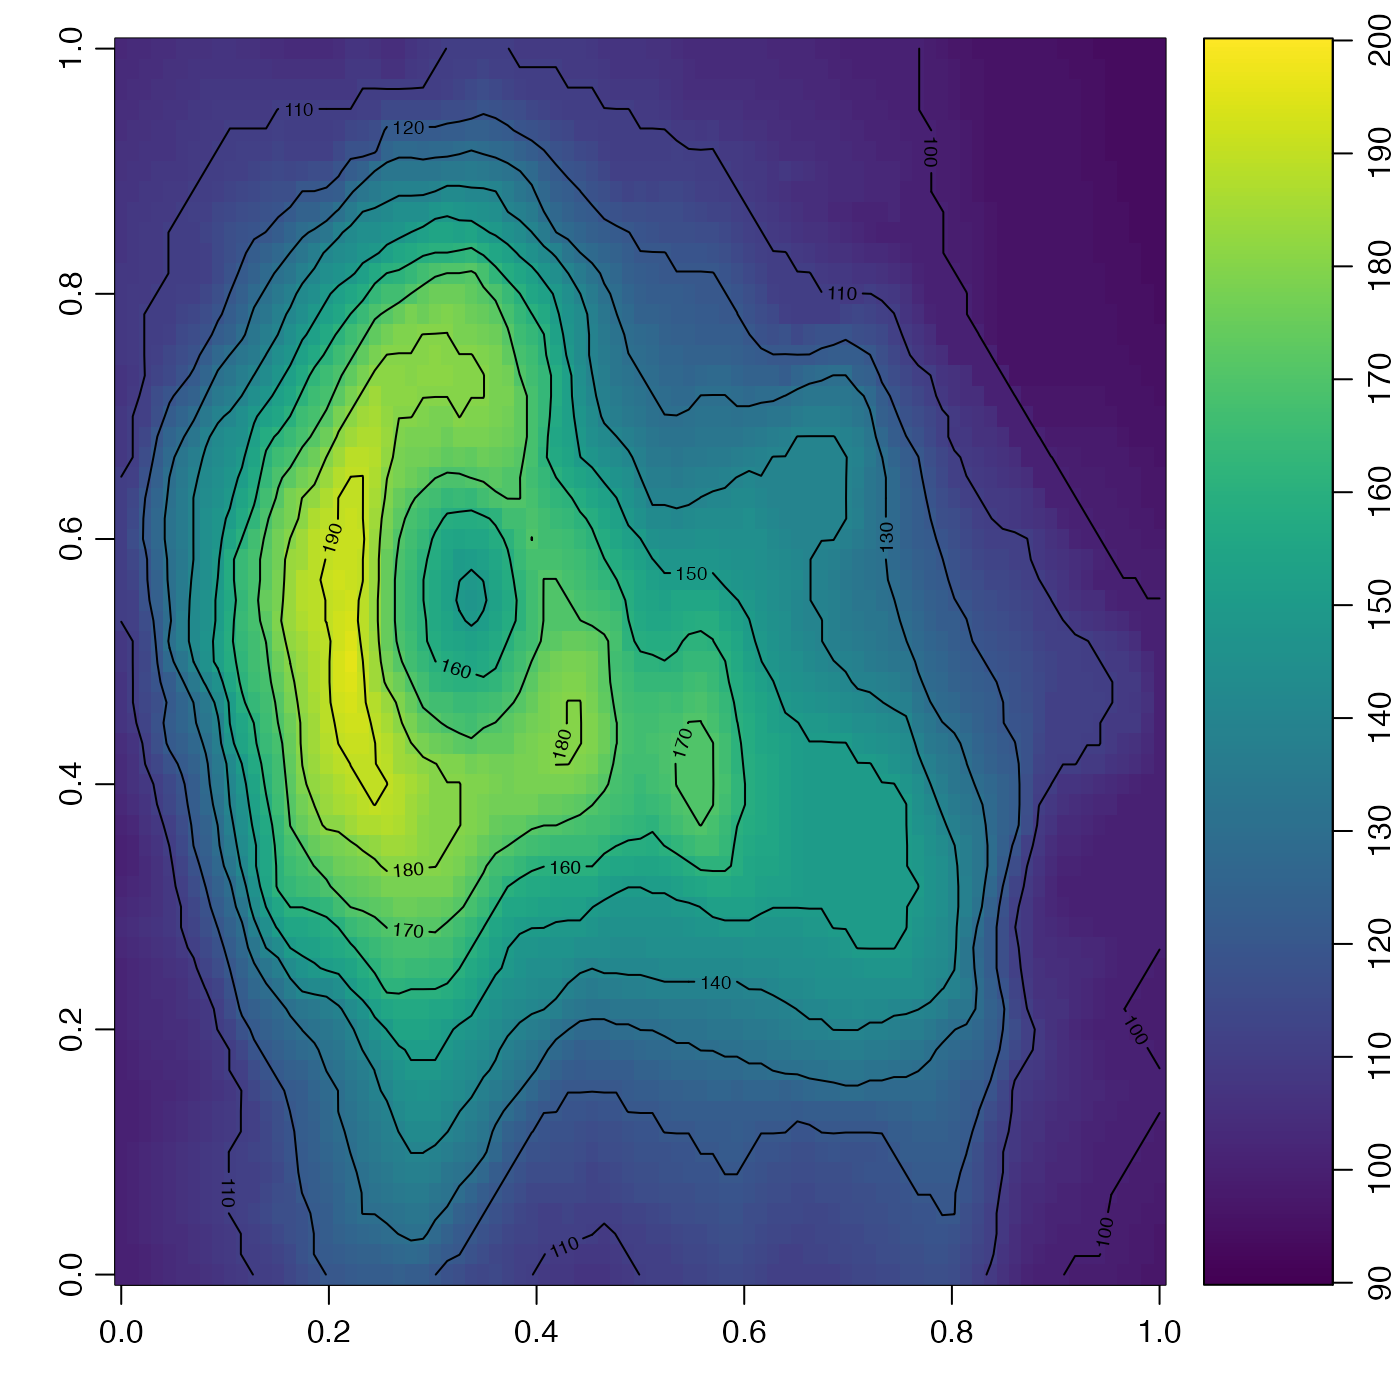
# 2. Use layout to mimic the action of imagep(), with the width
# of the palette region being 14 percent of figure width.
d <- 0.14
layout(matrix(1:2, nrow = 1), widths = c(1 - d, d))
image(volcano, col = oce.colorsViridis(100), zlim = c(90, 200))
contour(volcano, add = TRUE)
drawPalette(c(90, 200), fullpage = TRUE, col = oce.colorsViridis)
par(mar = omar) # reset margin
# 2. Use layout to mimic the action of imagep(), with the width
# of the palette region being 14 percent of figure width.
d <- 0.14
layout(matrix(1:2, nrow = 1), widths = c(1 - d, d))
image(volcano, col = oce.colorsViridis(100), zlim = c(90, 200))
contour(volcano, add = TRUE)
drawPalette(c(90, 200), fullpage = TRUE, col = oce.colorsViridis)