This returns a vector of numbers that build upon the shorter lists
provided in Chapter 10 of reference 1 and the more modern World
Ocean Atlases (e.g. reference 2).
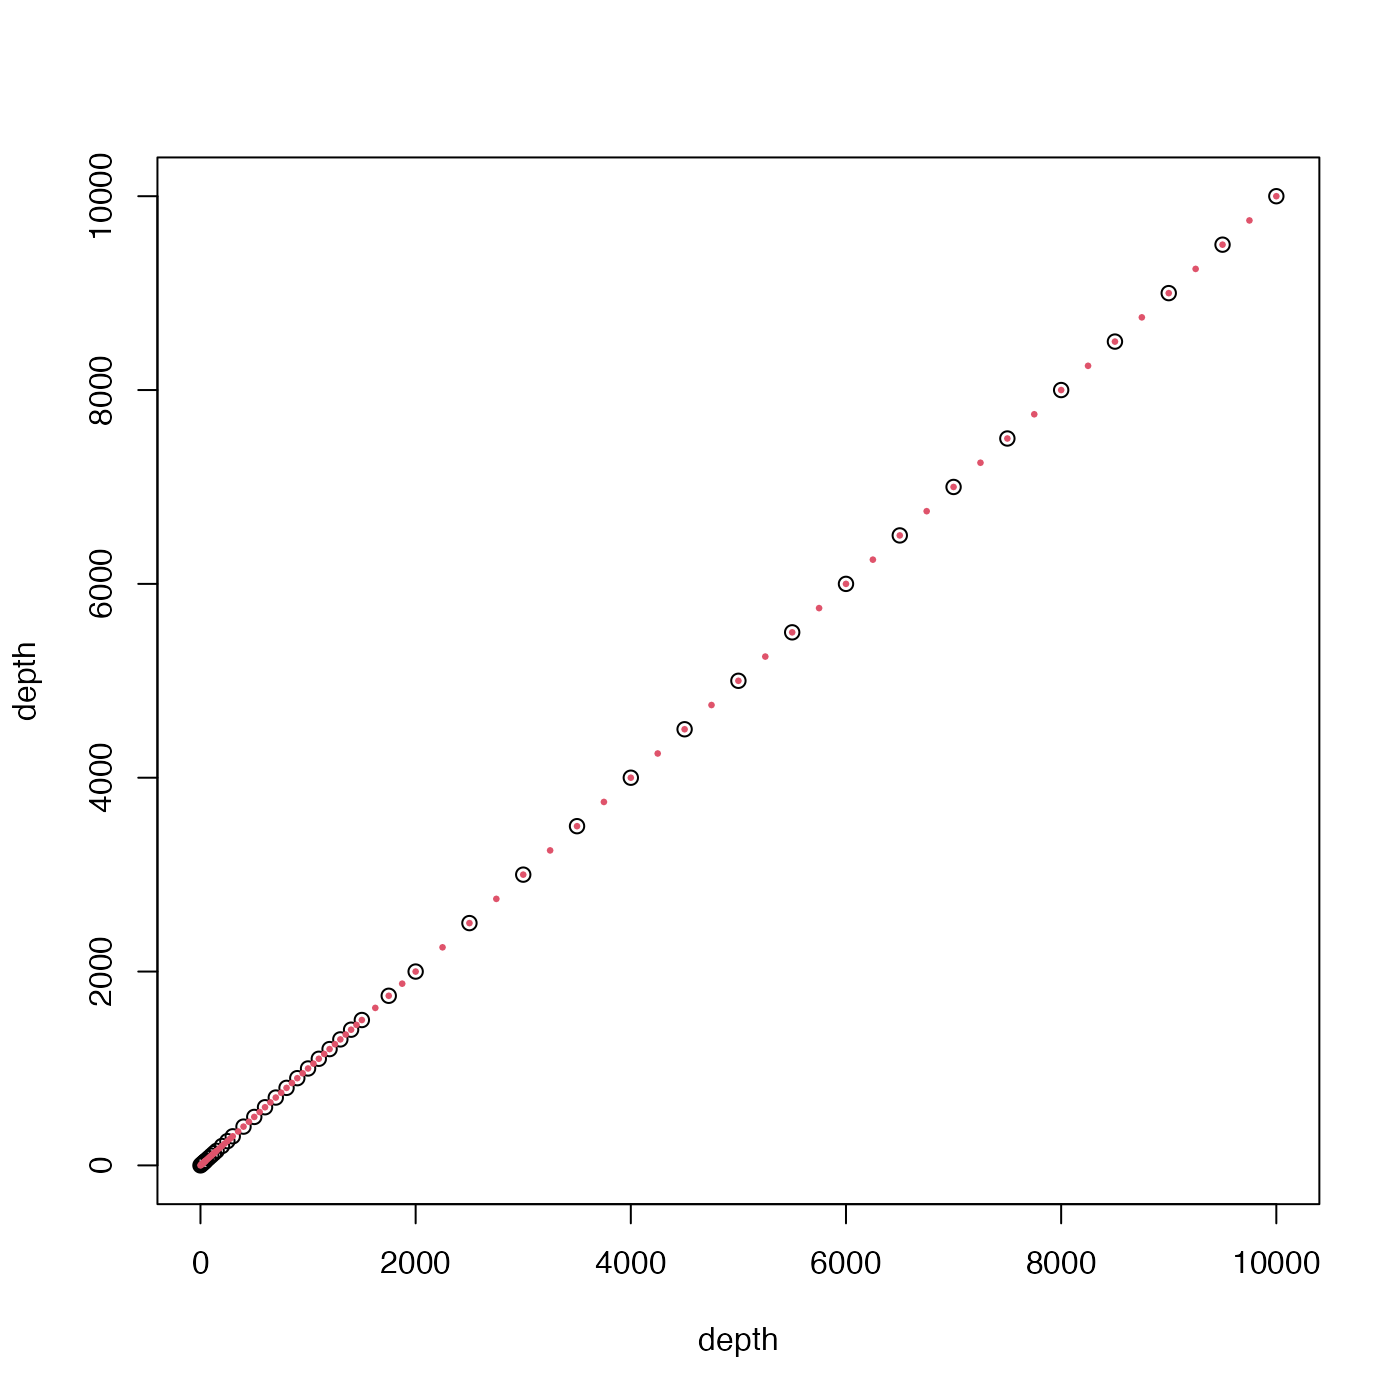
With the default call,
i.e. with n=0, the result is
c(0, 10, 20, 30, 40, 50, 75, 100, 125, 150, 200, 250,
seq(300, 1500, by=100), 1750, seq(2000, 10000, by=500))
.
For higher values of n, progressively more and more values
are added between each pair in this sequence.
See the documentation for
sectionGrid() for how standardDepths can be used
in gridding data for section plots.
Value
A vector of depths that are more closely spaced for small values, i.e. a finer grid near the ocean surface.
References
Sverdrup, H U, Martin W Johnson, and Richard H Fleming. The Oceans, Their Physics, Chemistry, and General Biology. New York: Prentice-Hall, 1942.
https://publishing.cdlib.org/ucpressebooks/view?docId=kt167nb66r
2.Locarnini, R. A., A. V. Mishonov, J. I. Antonov, T. P. Boyer, H. E. Garcia, O. K. Baranova, M. M. Zweng, D. R. Johnson, and S. Levitus. “World Ocean Atlas 2009 Temperature.” US Government printing Office, 2010.