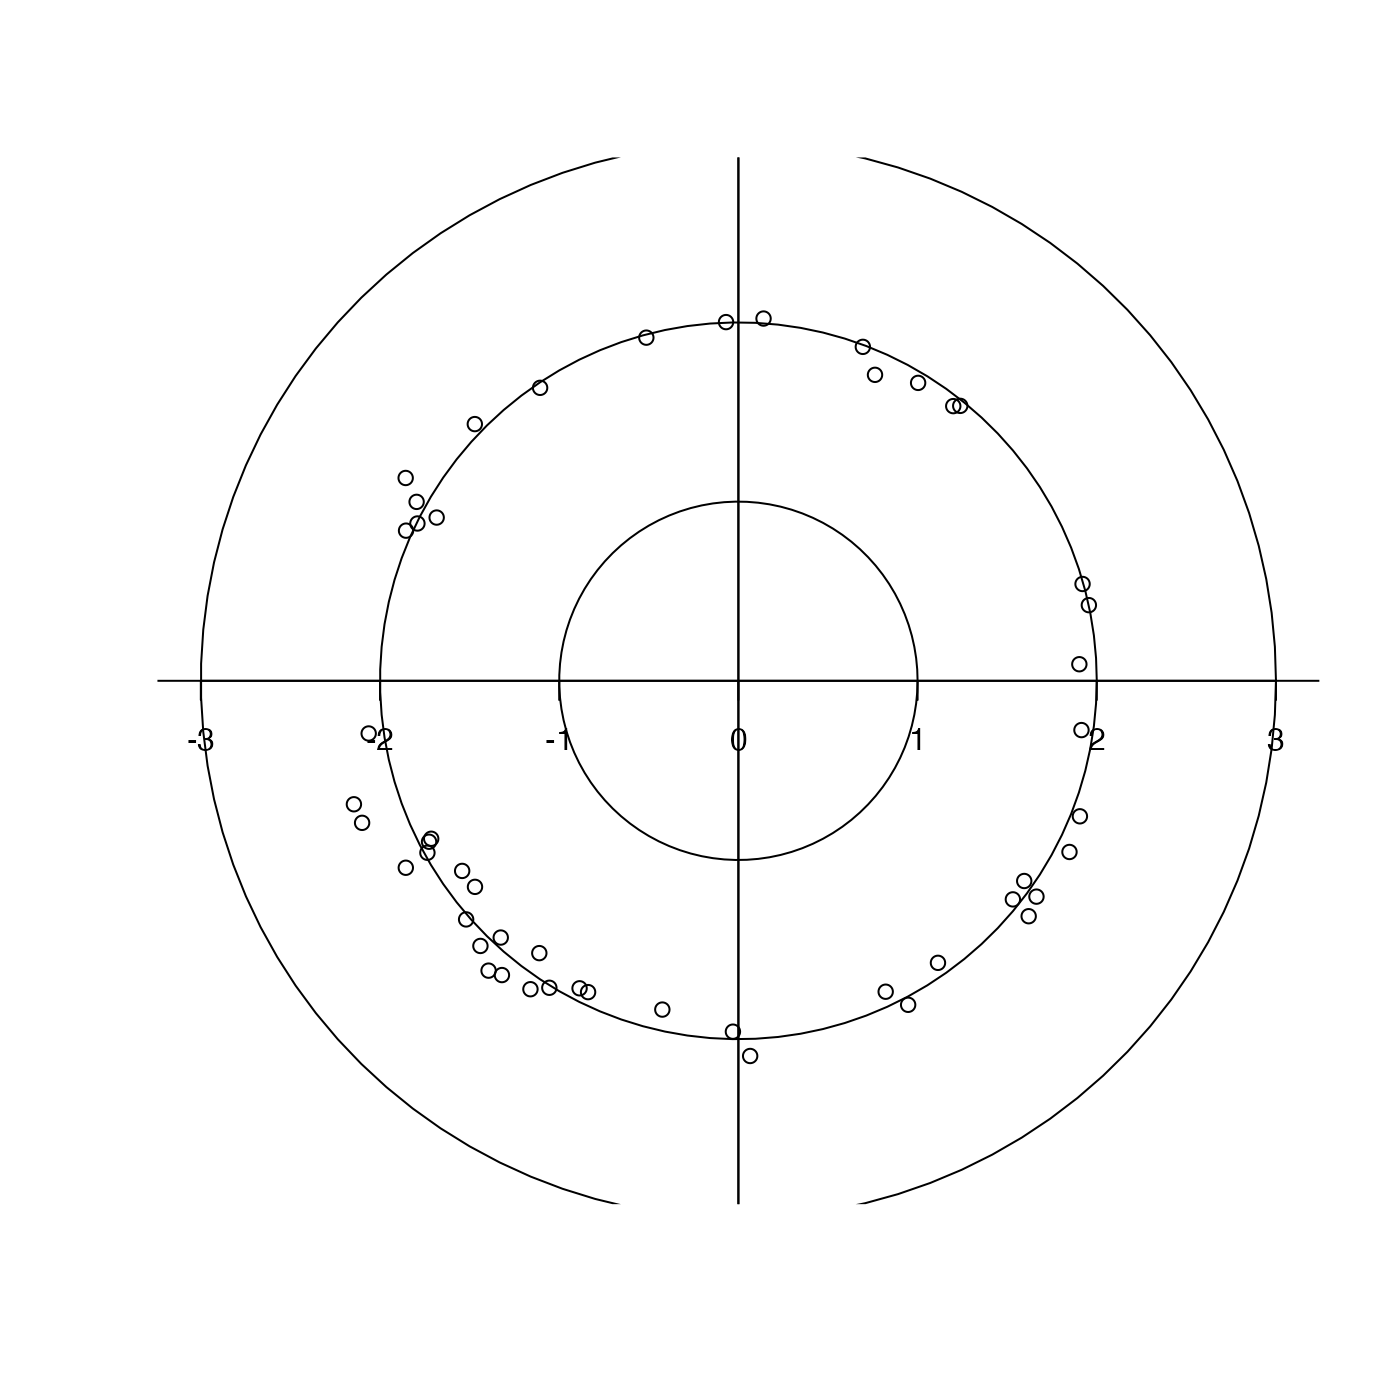
Creates a crude polar plot.
Usage
plotPolar(r, theta, debug = getOption("oceDebug"), ...)
Arguments
- r
radii of points to plot.
- theta
angles of points to plot, in degrees.
- debug
a flag that turns on debugging. Set to 1 to get a moderate
amount of debugging information, or to 2 to get more.
- ...
optional arguments passed to the lower-level plotting
functions.