binAverage() works by calling binMean1D(), after computing
the xbreaks parameter of the latter function as seq(xmin,xmax,xinc).
Note that the return value of binAverage() uses only the xmids and
result entries of the binMean1D() result.
Arguments
- x
a vector of numerical values.
- y
a vector of numerical values.
- xmin
x value at the lower limit of first bin; the minimum
xwill be used if this is not provided.- xmax
x value at the upper limit of last bin; the maximum
xwill be used if this is not provided.- xinc
width of bins, in terms of x value; 1/10th of
xmax-xminwill be used if this is not provided.- include.lowest
logical value indicating whether to include
yvalues for which the correspondingxis equal toxmin. See “Details”.- na.rm
logical value indicating whether to remove NA values before doing the computation of the average. This is passed to
mean(), which does the work of the present function.
Value
A list with two elements: x, the mid-points of the bins, and
y, the average y value in the bins.
Details
By default, the sub-intervals defined by xmin, xinc and xmax
arguments are open on the left and closed on the right, to match
the behaviour of cut(). An open interval does not include
points on the boundary, and so any x values that exactly match
the first breaks value will not be counted. To include
such points in the calculation, set include.lowest to TRUE.
See also
Other bin-related functions:
binApply1D(),
binApply2D(),
binCount1D(),
binCount2D(),
binMean1D(),
binMean2D()
Examples
library(oce)
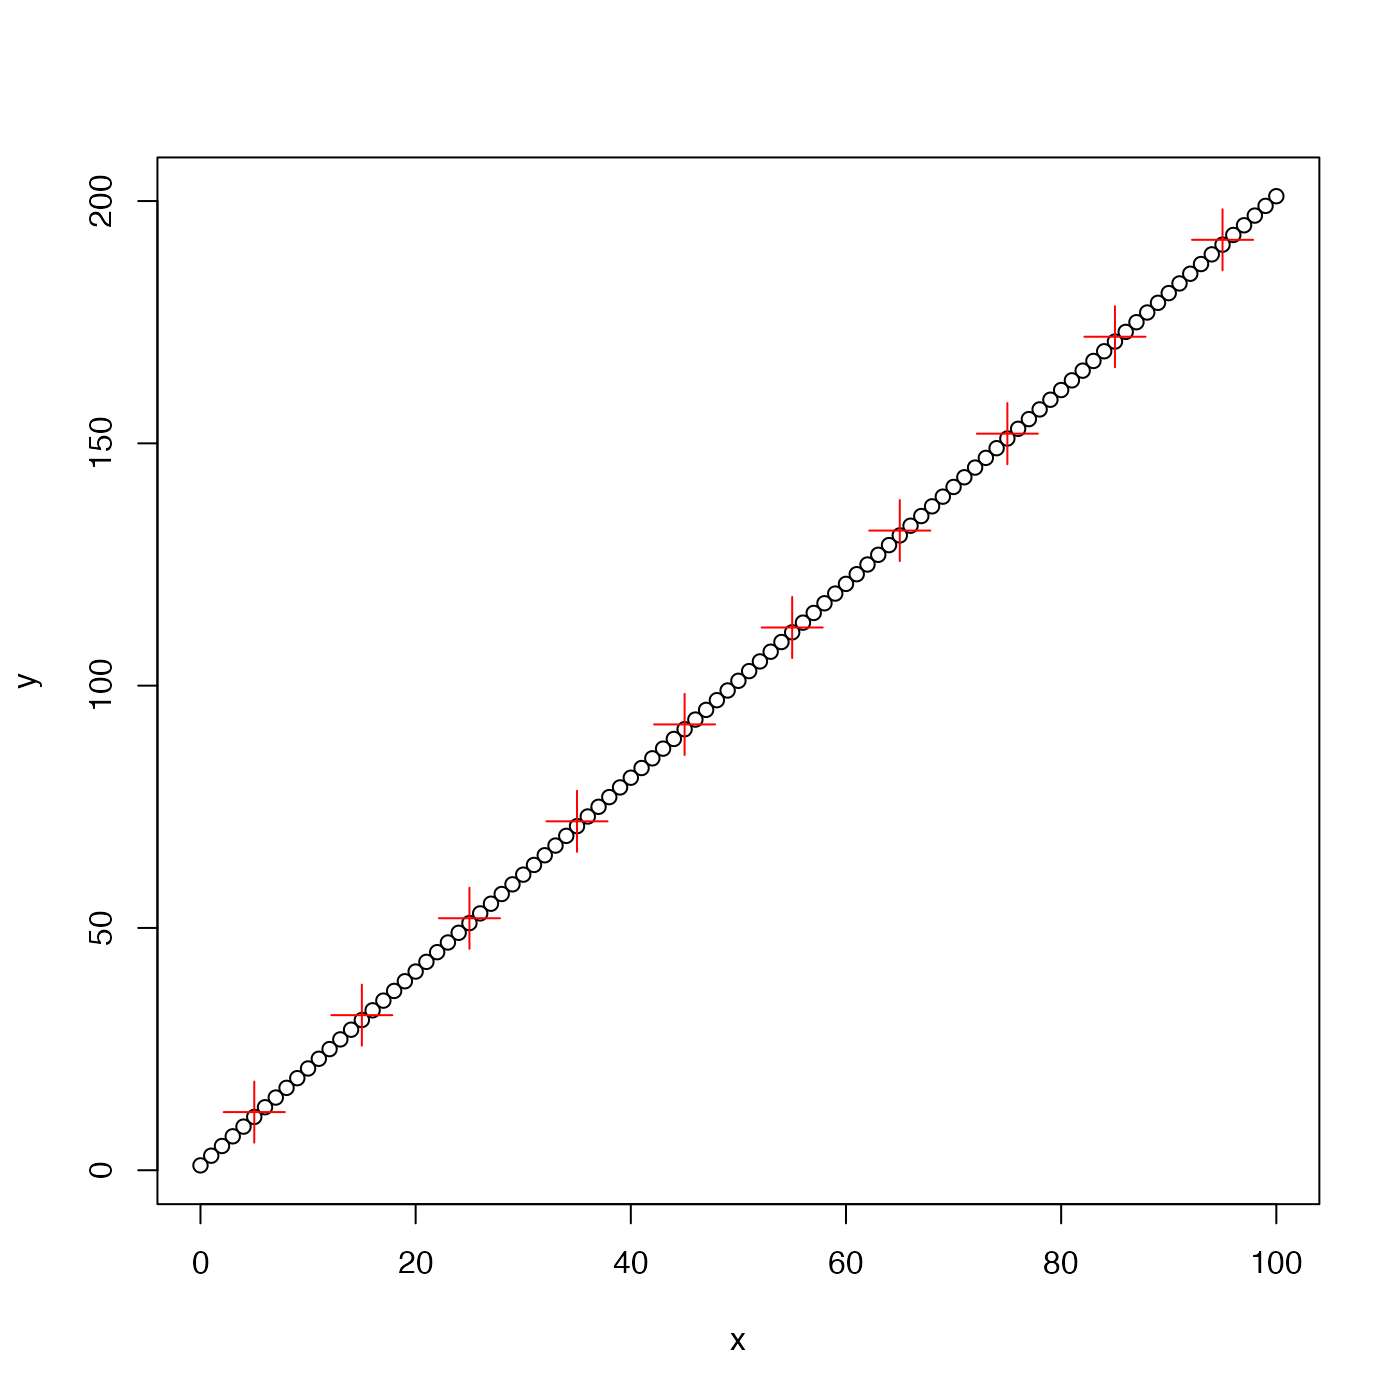
# A. fake linear data
x <- seq(0, 100, 1)
y <- 1 + 2 * x
plot(x, y, pch = 1)
ba <- binAverage(x, y)
points(ba$x, ba$y, pch = 3, col = "red", cex = 3)
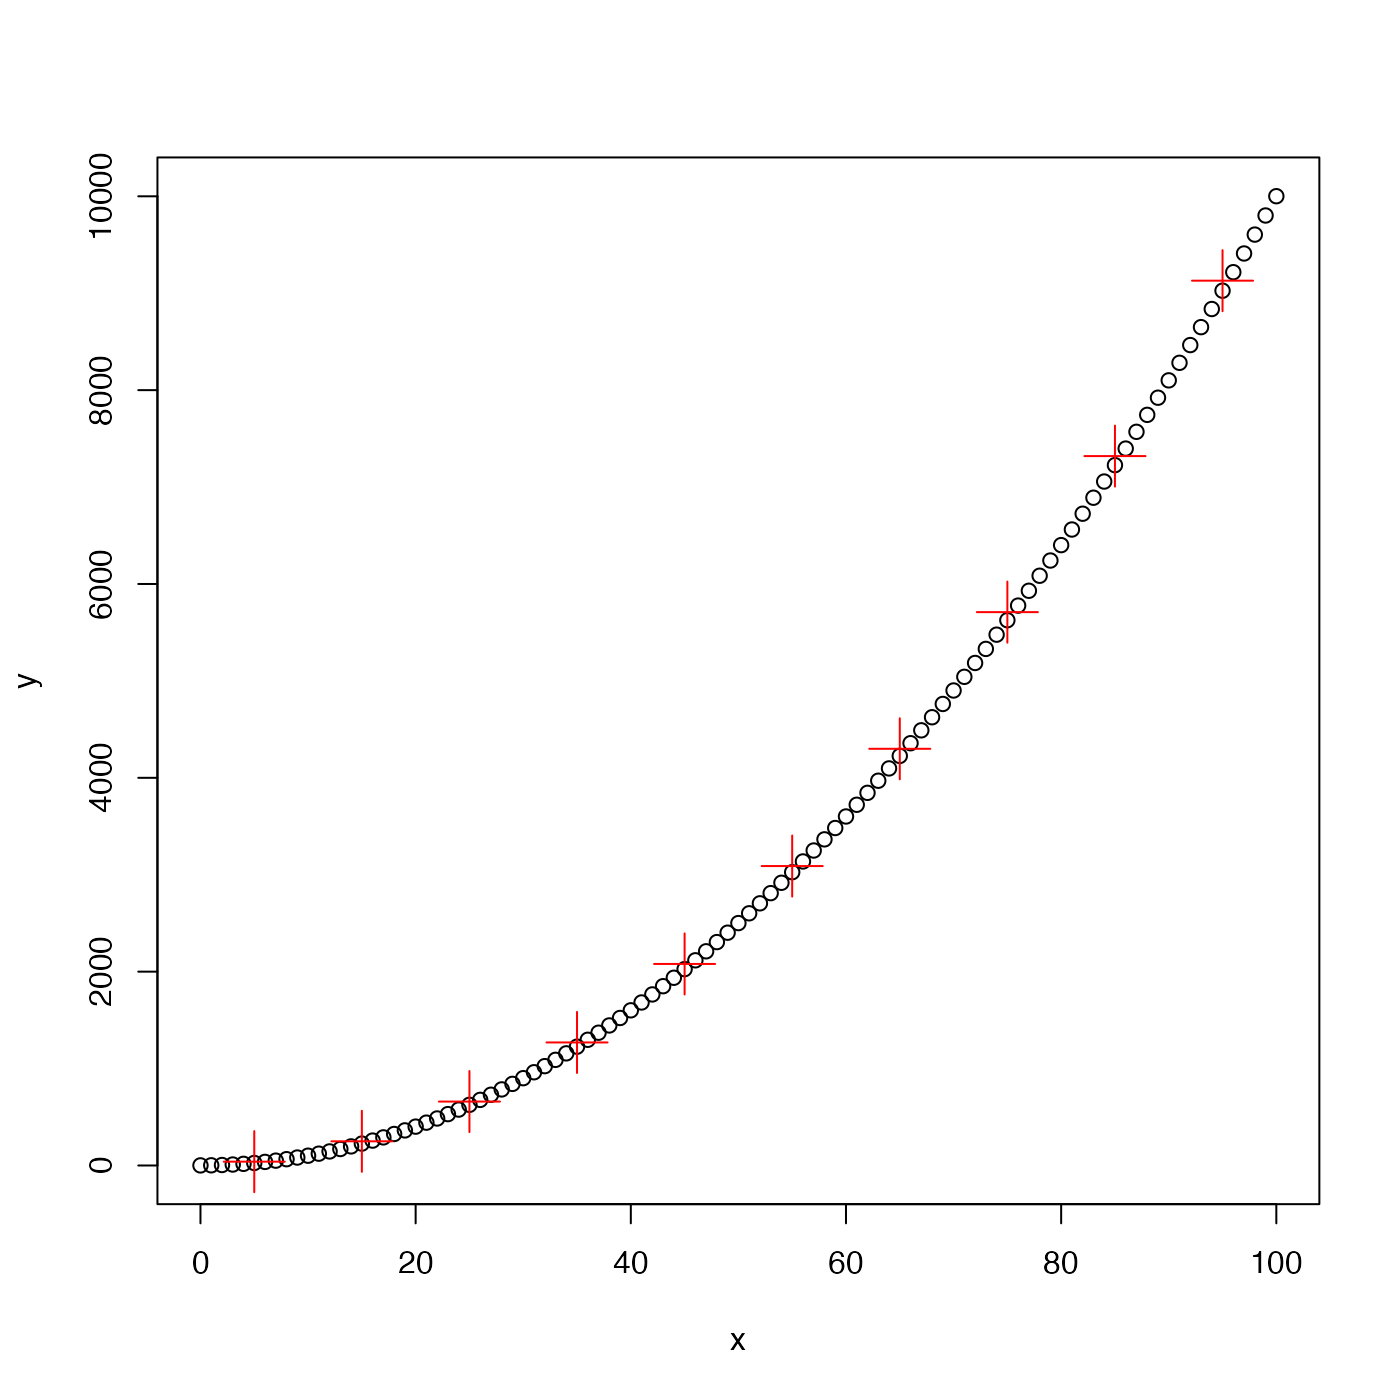
 # B. fake quadratic data
y <- 1 + x^2
plot(x, y, pch = 1)
ba <- binAverage(x, y)
points(ba$x, ba$y, pch = 3, col = "red", cex = 3)
# B. fake quadratic data
y <- 1 + x^2
plot(x, y, pch = 1)
ba <- binAverage(x, y)
points(ba$x, ba$y, pch = 3, col = "red", cex = 3)
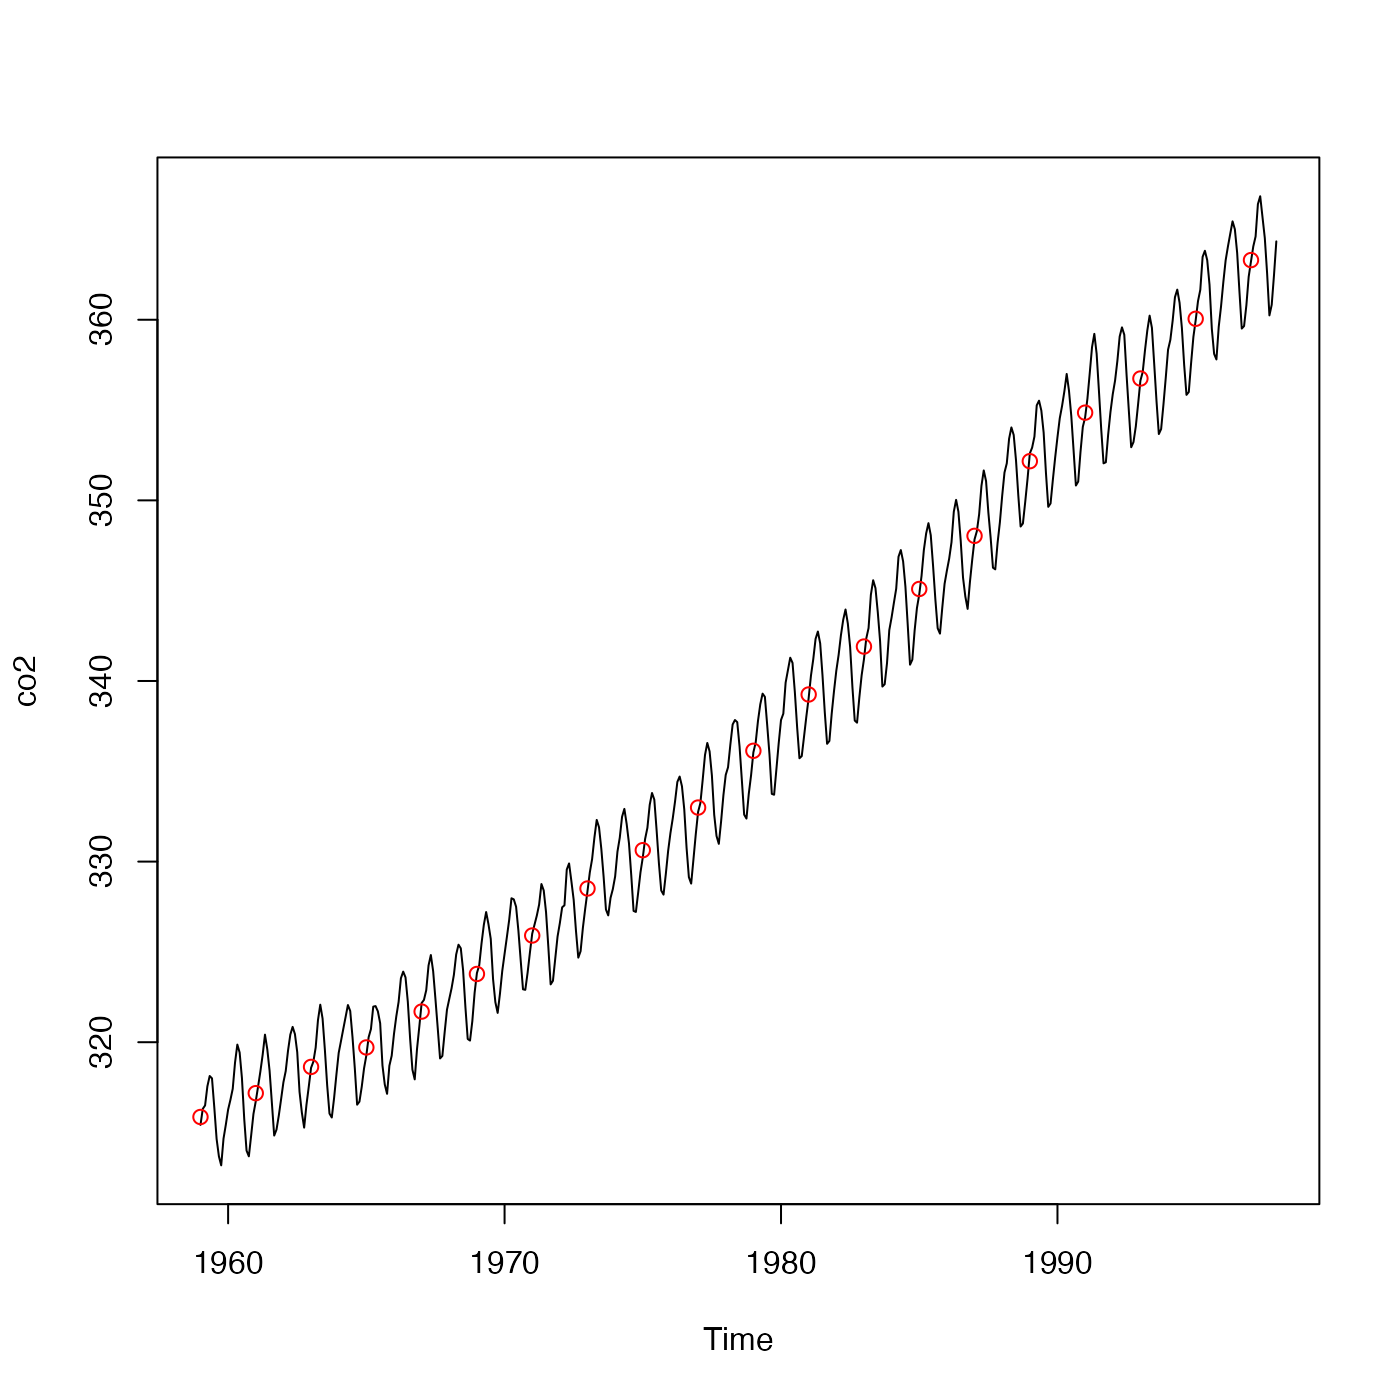
 # C. natural data
data(co2)
plot(co2)
avg <- binAverage(time(co2), co2, 1950, 2000, 2)
points(avg$x, avg$y, col = "red")
# C. natural data
data(co2)
plot(co2)
avg <- binAverage(time(co2), co2, 1950, 2000, 2)
points(avg$x, avg$y, col = "red")