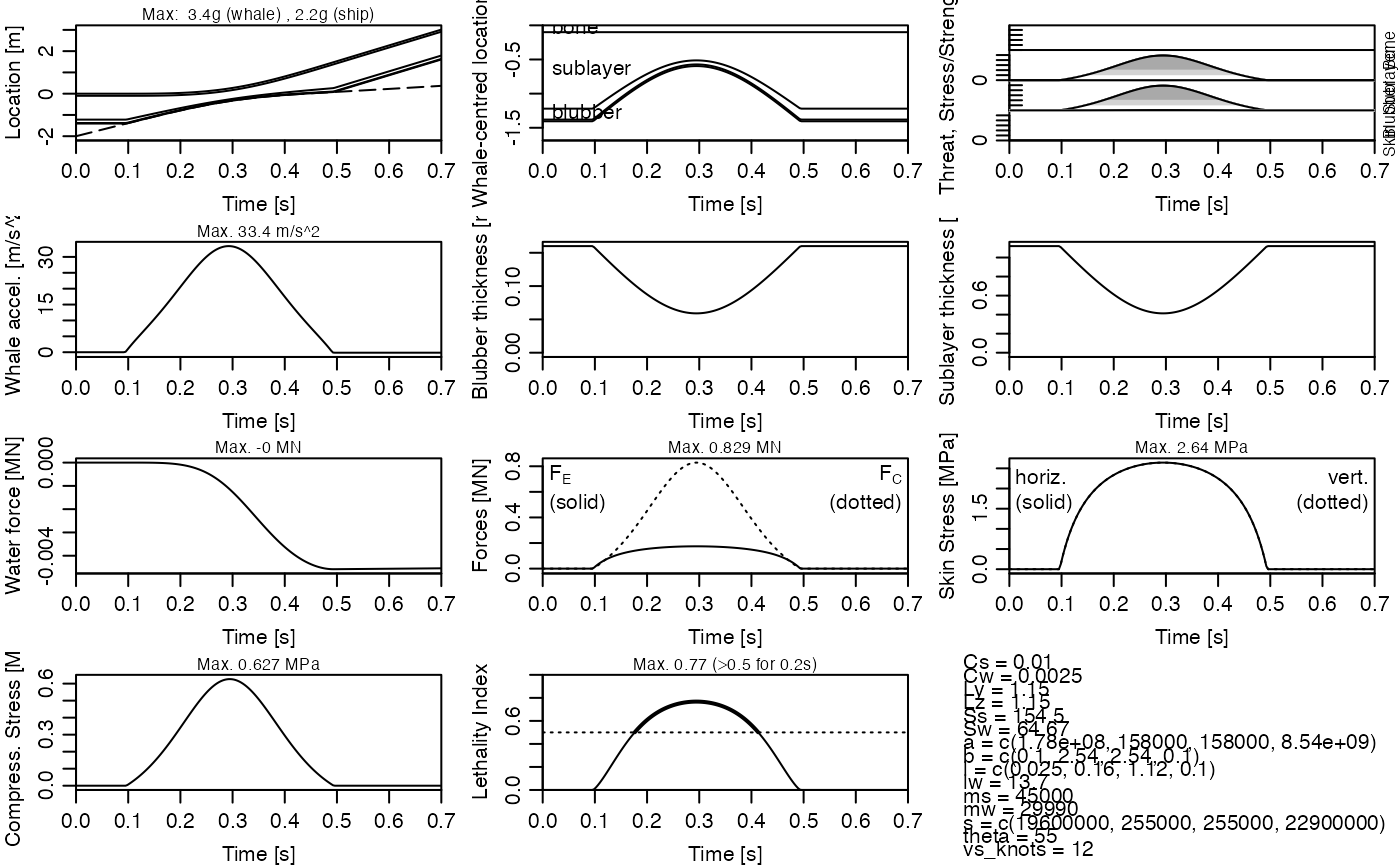
Creates displays of various results of a simulation performed
with strike().
Arguments
- x
An object created by
strike().- which
A character vector that indicates what to plot. This choices for its entries are listed below, in no particular order.
"location"for a time-series plot of boat locationxwin dashed black, whale centerlinexsin solid gray, blubber-interior interface in red, and skin in blue. The maximum acceleration of ship and whale (in "g" units) are indicated in notes placed near the horizontal axes. Those acceleration indications report just a single value for each of ship and whale, but if the blubber and sublayer have been squeezed to their limits, yielding a short and intense force spike as the bone compresses, then the summaries will also report on the spike duration and intensity. The spike is computed based on usingrunmed()on the acceleration data, with akvalue that is set to correspond to 5 ms, or to k=11, whichever is larger."section"to plot skin thickness, blubber thickness and sublayer thickness in one panel, creating a cross-section diagram."threat"a stacked plot showing time-series traces of an ad-hoc measure of the possible threat to skin, blubber and sublayer. The threat level is computed as the ratio of stress to ultimate strength, e.g. for blubber, it isx$WCF$stress/x$parms$s[2]. The same vertical scale is used in each of the subpanels that make up the stack. Any values exceeding 10 are clipped to 10, and in such a case the overall label on the vertical axis will note this clipping, although it should be easy to see, because the way it most often occurs is if the soft layers "bottom out" onto the bone, which yields a short period of very high stress, owing to the very high compression modulus of bone. Each of the curves is filled in with a light gray colour for stress/strength values up to 1, and with black for higher values; this makes it easy to tell at a glance whether the threat level is high."whale acceleration"for a time-series plot of whale acceleration."blubber thickness"for a time-series plot of blubber thickness."sublayer thickness"for a time-series plot of the thickness of the layer interior to the blubber."reactive forces"for a time-series showing the reactive forces associated with skin stretching (solid) and the compression of the blubber and sublayer components (dashed)."compression stress"for a time-series plot of the compression stress on the blubber and the layer to its interior. (These stresses are equal, under an equilibrium assumption.)"skin stress"for a time-series of skin stress in the along-skin y and z directions."lethality index"for a time-series of Lethality Index, computed from compression stress usinglethalityIndexFromStress(). Values of Lethality Index that exceed 0.5 are highlighted, and a dotted line is drawn at that value."values"for a listing ofparamvalues."all"for all of the above."default"for a three-element plot showing"location","section", and"threat".
- drawEvents
Logical, indicating whether to draw lines for some events, such as the moment of closest approach.
- colwcenter
Colour used to indicate the whale centre.
- colwinterface
Colour used to indicate the interface between whale blubber and sublayer.
- colwskin
Colour used to indicate the whale skin.
- cols
As
colw, but the colour to be used for the ship bow location, which is drawn with a dashed line.- colThreat
a 4-element colour specification used in
"threat"plots. The colour transitions depend on the layer being plotted. For skin and bone (i.e. in the bottom and top subpanels of the plot), the first colour is used up to a stress:strength ratio of 1/4, the second up to 1/2, the third up to 3/4, and the fourth above 3/4. For blubber and sublayer (i.e. the second and third subpanels, counting from the bottom), the colours are defined by comparing compressive stress to the values oftau25,tau50andtau75(see theparameters()documentation), with the first colour for stress undertau25, the second for stress up totau50, the third for stress up totau75, and the fourth for higher stresses.- lwd
Line width used in plots for time intervals in which damage criteria are not exceeded.
- D
Factor by which to thicken lines during times during which damage criteria are exceeded.
- debug
Integer indicating debugging level, 0 for quiet operation and higher values for more verbose monitoring of progress through the function.
- ...
Ignored.
References
See whalestrike() for a list of references.
Examples
# 1. default 3-panel plot
t <- seq(0, 0.7, length.out = 200)
state <- c(xs = -2, vs = knot2mps(12), xw = 0, vw = 0) # 12 knot ship
parms <- parameters() # default values
sol <- strike(t, state, parms)
par(mar = c(3, 3, 1, 1), mgp = c(2, 0.7, 0), mfrow = c(1, 3))
plot(sol)

# 2. all 12 plot types
par(mar = c(3, 3, 1, 1), mgp = c(2, 0.7, 0), mfrow = c(4, 3))
plot(sol, "all")
