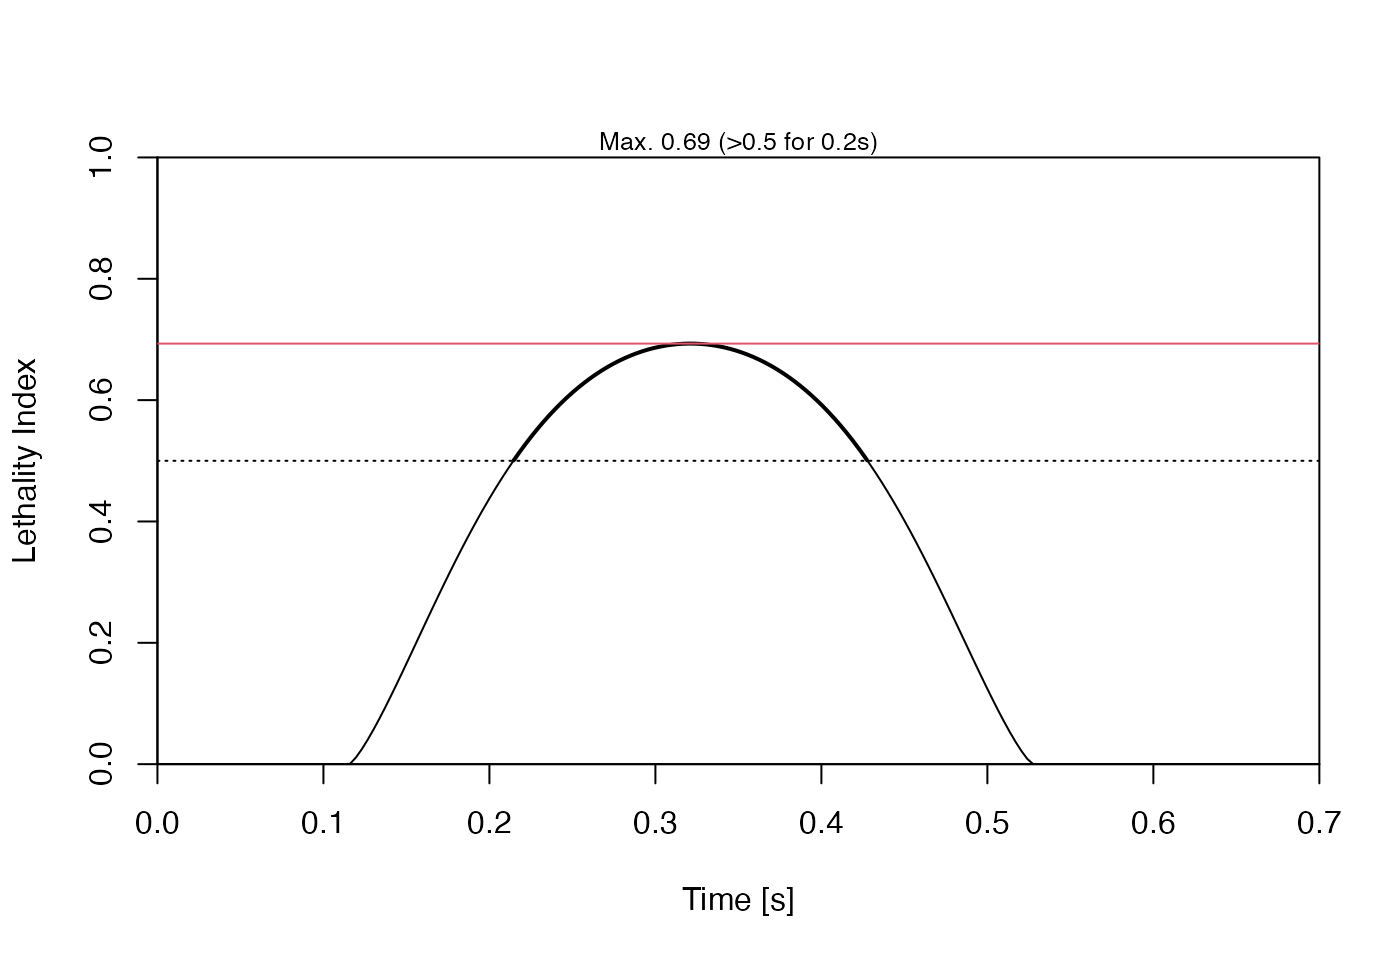
This works by finding the maximum Lethality Index encountered during
a simulation created by calling strike(), and so it is important to
use a detailed setting for the output times. In the example, the
results are reported every 0.7/200 seconds (i.e. 3.5 milliseconds),
which is likely sufficient (see the example, where a plot is
used for this assessment).
Value
The maximum value of the Lethality Index that is involved in the simulation of the ship-whale collision event. This is a unitless number; see Kelley et al. (2021).
References
Kelley, Dan E., James P. Vlasic, and Sean W. Brillant. "Assessing the Lethality of Ship Strikes on Whales Using Simple Biophysical Models." Marine Mammal Science 37, no. 1 (January 2021): 251–67.
See also
Other functions dealing with Whale Lethality index:
lethalityIndexFromStress(),
stressFromLethalityIndex()
Examples
library(whalestrike)
t <- seq(0, 0.7, length.out = 200)
state <- list(xs = -2, vs = knot2mps(10), xw = 0, vw = 0)
parms <- parameters()
s <- strike(t, state, parms)
# Compute the desired value and (for context) show it on a plot
maximumLethalityIndex(s)
#> [1] 0.6931811
# For context, this is how this can be done "by hand"
max(lethalityIndexFromStress(s[["WCF"]][["stress"]]))
#> [1] 0.6931811
# Show the maximum on a plot (see also the plot title)
plot(s, which = "lethality index")
abline(h=maximumLethalityIndex(s), col=2)