This depends on calculations based on the digitized shape of
a whale necropsy, which is provided by whaleShape().
The results are
\(0.143 * L^2\)
for the projected area (see reference 1)
and
\(0.448 * (0.877 * L)^2\)
for the wetted area
(see reference 2, but note that we use a correction related to whale mass).
Arguments
- L
whale length in metres.
- species
a string indicating the whale species. In the present version of the package, this parameter is ignored, and it is assumed that the formula developed for North Atlantic Right Whales will be applicable to other species. This is not a large concern, because the area only affects the water drag, which will not be large during the short interval of a ship impact.
- type
character string indicating the type of area, with
"projected"for a side-projected area, and"wetted"for the total wetted area. The wetted area was computed by mathematically spinning a spline fit to the side-view. In both cases, the original data source is the necropsy side-view presented in Daoust et al. (2018).
Details
Note that multiple digitizations were done, and that the coefficients used in the formulae agreed to under 0.7 percent percent between these digitizations.
References
Dan Kelley's internal document
dek/20180623_whale_area.Rmd, available upon request.Dan Kelley's internal document
dek/20180707_whale_mass.Rmd, available upon request.Daoust, Pierre-Yves, Emilie L. Couture, Tonya Wimmer, and Laura Bourque. "Incident Report. North Atlantic Right Whale Mortality Event in the Gulf of St. Lawrence, 2017." Canadian Wildlife Health Cooperative, Marine Animal Response Society, and Fisheries and Oceans Canada, 2018. https://publications.gc.ca/site/eng/9.850838/publication.html.
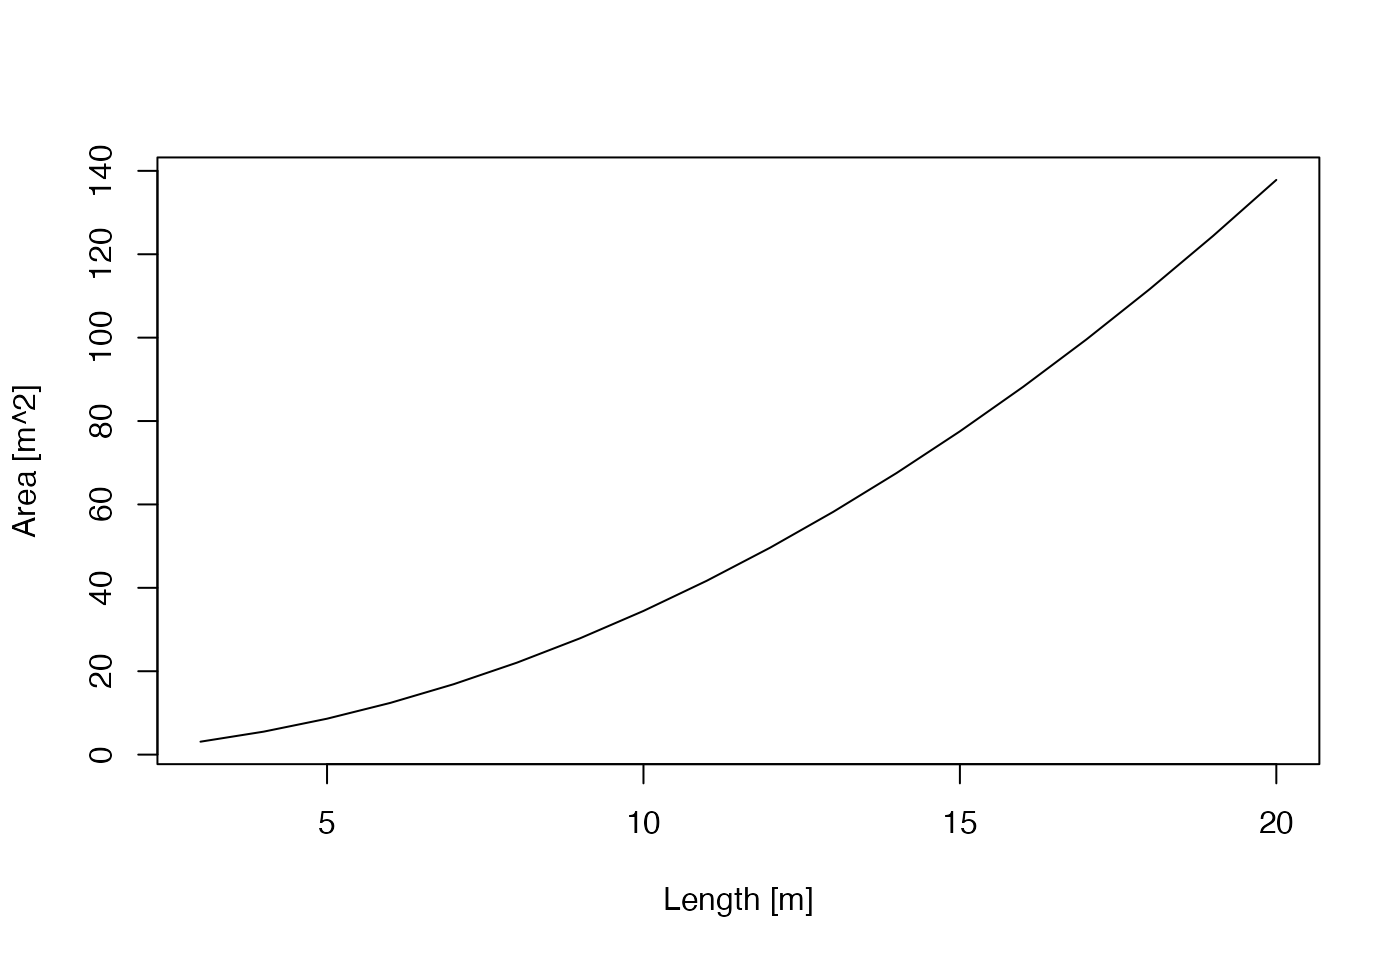
Examples
L <- 3:20
A <- whaleAreaFromLength(L)
plot(L, A, xlab = "Length [m]", ylab = "Area [m^2]", type = "l")