World Ocean Atlas changes
Jan 26, 2015
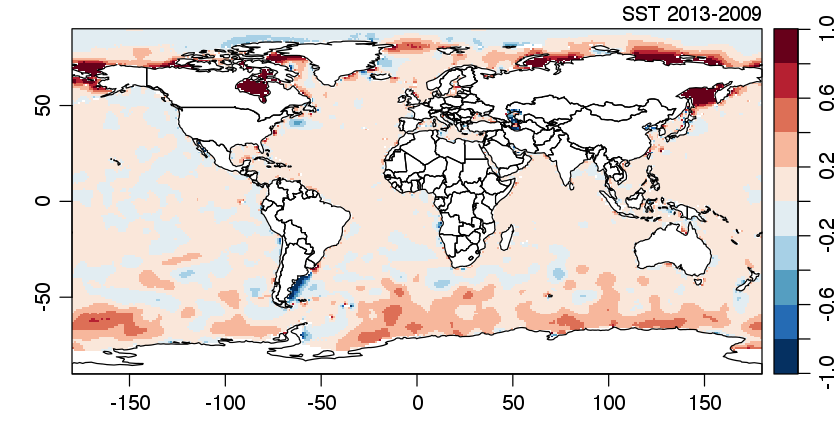
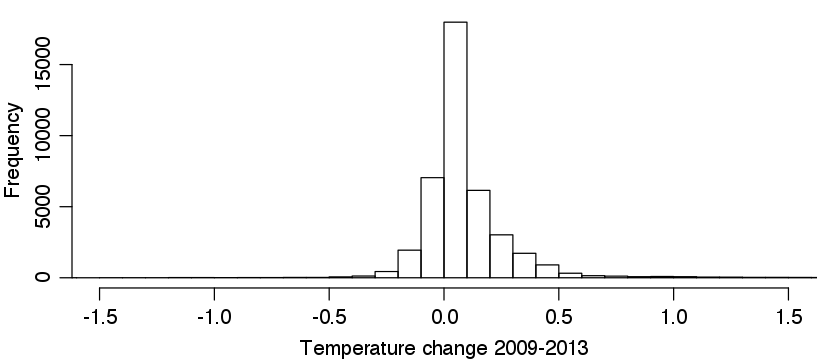
Changes from WOA2009 to WOA2013 are illustrated.
Introduction
The ocedata R package has a dataset named levitus, which stores sea-surface temperature and salinity. Today, the development version of ocedata (available at github) was updated from the 2009 version of this atlas to the 2013 version. Differences between the two datasets are illustrated here.
Methods
The code provided below requires that the old dataset be saved into an RDA file. The other trick is that 2009 dataset had longitude running from 0 to 360, whereas the 2013 version has it running from -180 to 180, so the matrices have to be sliced and diced a little bit.
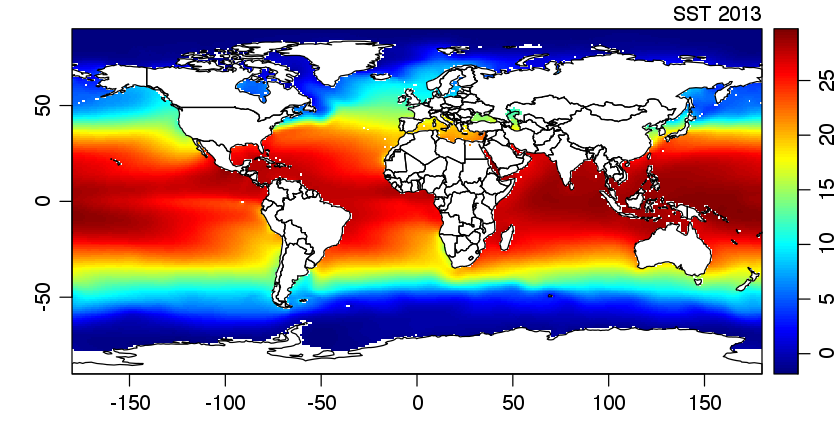
Temperature comparison.
1
2
3
4
5
6
7
8
9
10
11
12
13
14
15
16
library(oce)
load("~/ocedata-levitus-before-20150126.rda")
SST2009 <- levitus$SST
SST2009[1:180,] <- levitus$SST[181:360,]
SST2009[181:360,] <- levitus$SST[1:180,]
data(levitus, package="ocedata")
data(coastlineWorld)

imagep(levitus$longitude, levitus$latitude, levitus$SST, zlab="SST 2013", col=oceColorsJet, asp=1)
lines(coastlineWorld[["longitude"]], coastlineWorld[["latitude"]])

imagep(levitus$longitude, levitus$latitude, levitus$SST-SST2009, zlab="SST 2013-2009", asp=1, breaks=seq(-1,1,0.2))
lines(coastlineWorld[["longitude"]], coastlineWorld[["latitude"]])

par(mar=c(3, 3, 0.5, 1), mgp=c(2, 0.7, 0))
hist(levitus$SST-SST2009, breaks=100, xlim=c(-1.5, 1.5), xlab="Temperature change 2009-2013", main="")
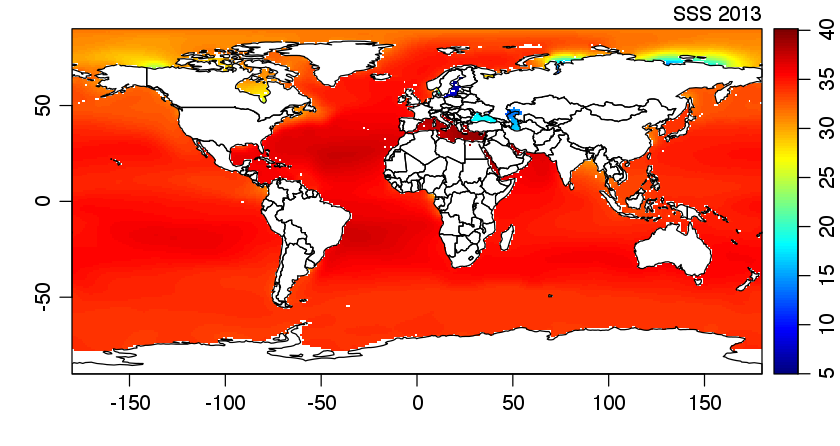
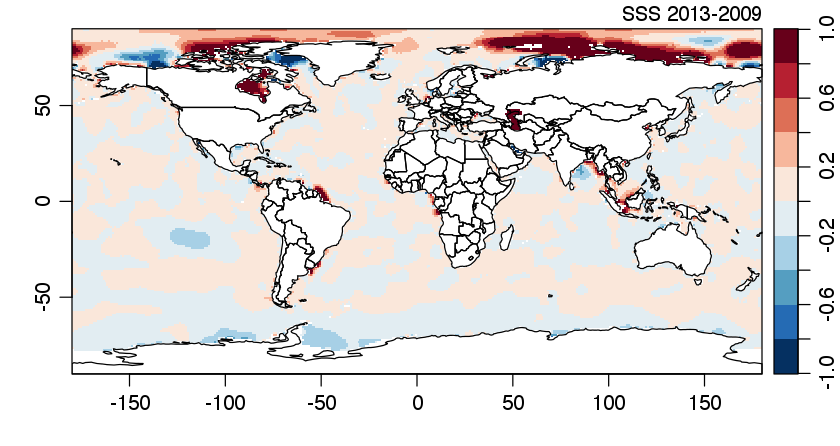
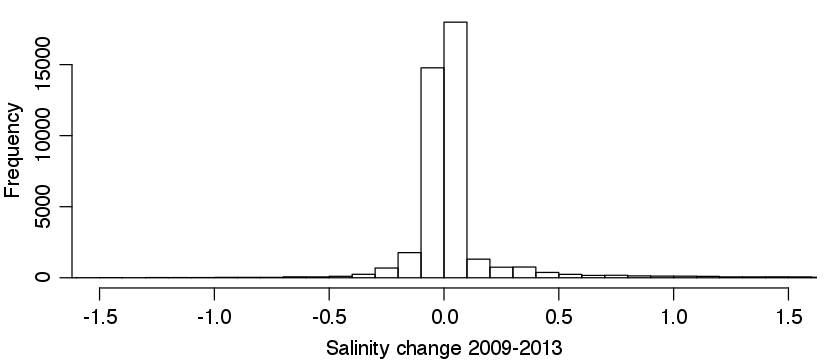
Salinity comparison.
1
2
3
4
5
6
7
8
9
10
11
12
13
14
15
16
17
library(oce)
load("~/ocedata-levitus-before-20150126.rda")
SSS2009 <- levitus$SSS
SSS2009[1:180,] <- levitus$SSS[181:360,]
SSS2009[181:360,] <- levitus$SSS[1:180,]
data(levitus, package="ocedata")
data(coastlineWorld)

imagep(levitus$longitude, levitus$latitude, levitus$SSS, zlab="SSS 2013", col=oceColorsJet, asp=1)
lines(coastlineWorld[["longitude"]], coastlineWorld[["latitude"]])
dev.off()

imagep(levitus$longitude, levitus$latitude, levitus$SSS-SSS2009, zlab="SSS 2013-2009", asp=1, breaks=seq(-1,1,0.2))
lines(coastlineWorld[["longitude"]], coastlineWorld[["latitude"]])

par(mar=c(3, 3, 0.5, 1), mgp=c(2, 0.7, 0))
hist(levitus$SSS-SSS2009, breaks=100, xlim=c(-1.5, 1.5), xlab="Salinity change 2009-2013", main="")
Results
Temperature comparison.
Salinity comparison.