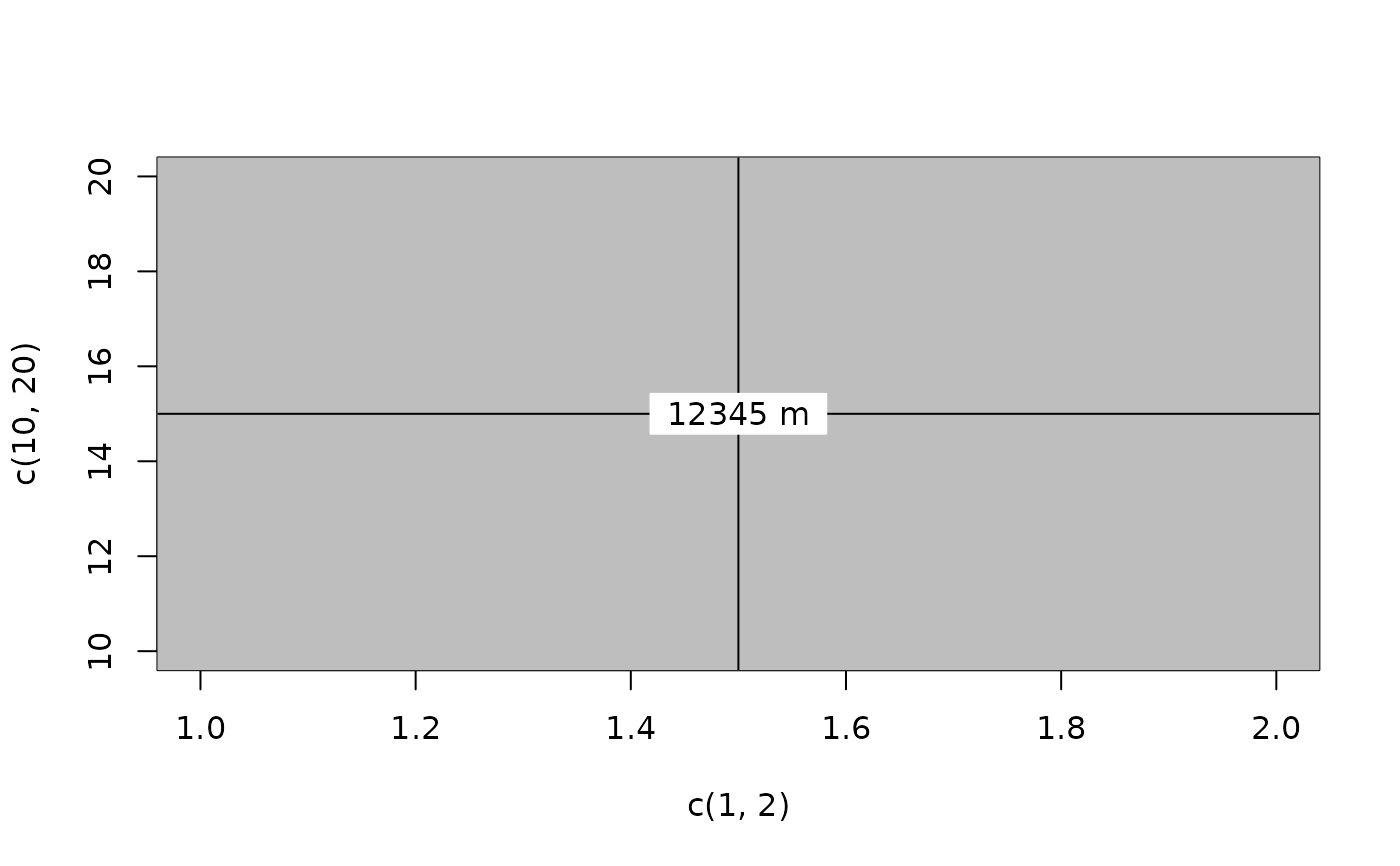
This is useful for adding text to busy plots, as the altitude labels in
skew-T diagrams created with plot.sounding().
Arguments
- x, y, labels, font, cex, col
as for
text().- bg
colour for the box underlay.
This is useful for adding text to busy plots, as the altitude labels in
skew-T diagrams created with plot.sounding().
as for text().
colour for the box underlay.