Introduction
For several years, oce has used the rgdal::transform() function for
map-projection calculations. This cannot continue, given that the rgdal
developers intend to deprecate transform(). Lately, I have been exploring the
possibility of switching to sf::st_transform() for map-projection
calculations. This work is being done in the sf branch of oce. In the
present initial phase of the transition, calculations are done with both
rgdal::transform() and sf::st_transform(), and warnings are issued if the
results differ. (This requires version 0.8.1 of the st package, which is
presently only available on github.)
This blog posting tests the sf branch of oce against the projections used in
the 2015-04-03-oce-proj
posting. My quick scan
shows that this works as expected.
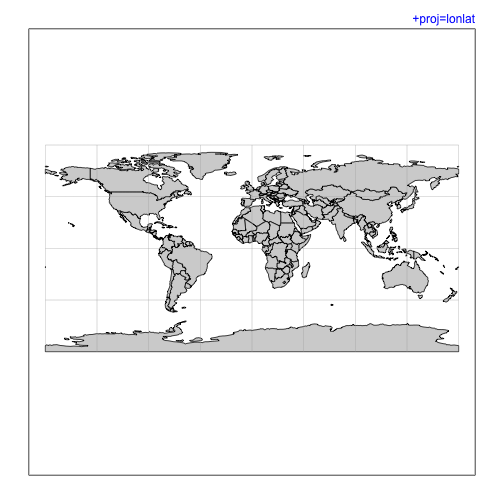
Note that this version of oce accepts lonlat and longlat as synonyms, and the same for latlon and latlong.
1
2
3
4
5
6
7
8
9
10
11
12
13
14
library(oce)
data(coastlineWorld)
cl45 <- coastlineCut(coastlineWorld, lon_0=-45)

par(mar=rep(2, 4))
line <- 0.25
pcol <- "blue"
ecol <- "red"
font <- 1
col <- "lightgray"

p <- "+proj=aea +lat_1=10 +lat_2=60 +lon_0=-40"
mapPlot(coastlineWorld, projection=p, longitudelim=c(-80,0), latitudelim=c(0,45), col=col)
mtext(p, line=line, adj=1, col=pcol, font=font)

1
2
3
4
p <- "+proj=aeqd +lon_0=-45"
mapPlot(coastlineWorld, projection=p,
        longitudelim=c(-80,0), latitudelim=c(0,60), col=col)
mtext(p, line=line, adj=1, col=pcol, font=font)

1
2
3
4
5
p <- "+proj=aitoff +lon_0=-45"
mapPlot(coastlineWorld, projection=p,
        longitudelim=c(-80,0), latitudelim=c(0,60), col=col)
mtext(p, line=line, adj=1, col=pcol, font=font)
mtext("Problem at top, unless coastlineCut() used", line=line, adj=0, col=ecol, font=font)

1
2
3
4
5
p <- "+proj=aitoff +lon_0=-45"
mapPlot(cl45, projection=p,
        longitudelim=c(-80,0), latitudelim=c(0,60), col=col)
mtext(p, line=line, adj=1, col=pcol, font=font)
mtext("Using coastlineCut()", line=line+0.9, adj=1, col=pcol, font=font)

1
2
3
p <- "+proj=bipc"
mapPlot(coastlineWorld, projection=p, longitudelim=c(-80,0), latitudelim=c(70, 110), col=col)
mtext(p, line=line, adj=1, col=pcol, font=font)

1
2
3
p <- "+proj=bonne +lat_1=45"
mapPlot(coastlineWorld, projection=p, col=col)
mtext(p, line=line, adj=1, col=pcol, font=font)

1
2
3
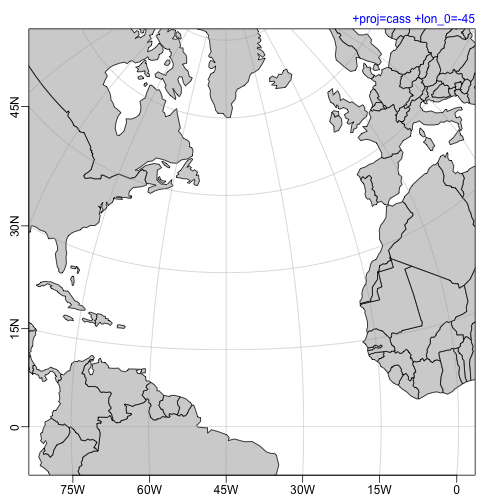
p <- "+proj=cass +lon_0=-45"
mapPlot(coastlineWorld, projection=p, longitudelim=c(-80,0), latitudelim=c(0,60), col=col)
mtext(p, line=line, adj=1, col=pcol, font=font)
1
2
3
4
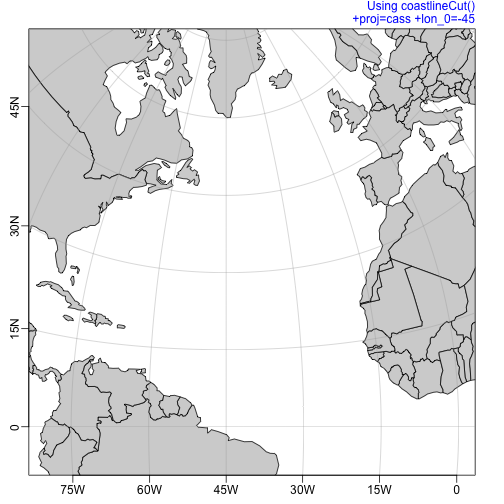
p <- "+proj=cass +lon_0=-45"
mapPlot(cl45, projection=p, longitudelim=c(-80,0), latitudelim=c(0,60), col=col)
mtext(p, line=line, adj=1, col=pcol, font=font)
mtext("Using coastlineCut()", line=line+0.9, adj=1, col=pcol, font=font)
1
2
3
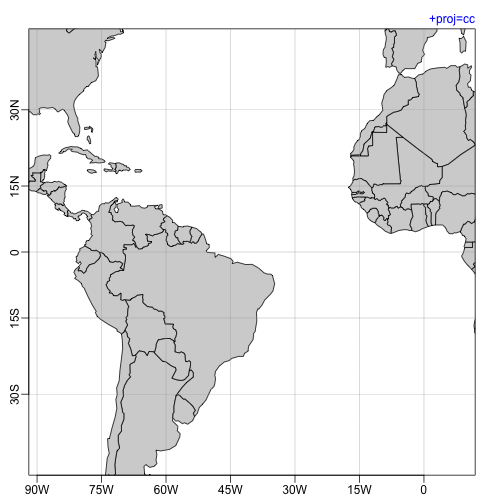
p <- "+proj=cc"
mapPlot(coastlineWorld, projection=p, longitudelim=c(-80,0), latitudelim=c(-40,40), col=col)
mtext(p, line=line, adj=1, col=pcol, font=font)
1
2
3
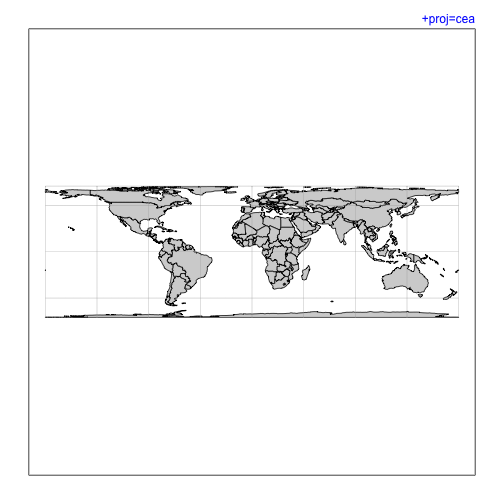
p <- "+proj=cea"
mapPlot(coastlineWorld, projection=p, col=col)
mtext(p, line=line, adj=1, col=pcol, font=font)
1
2
3
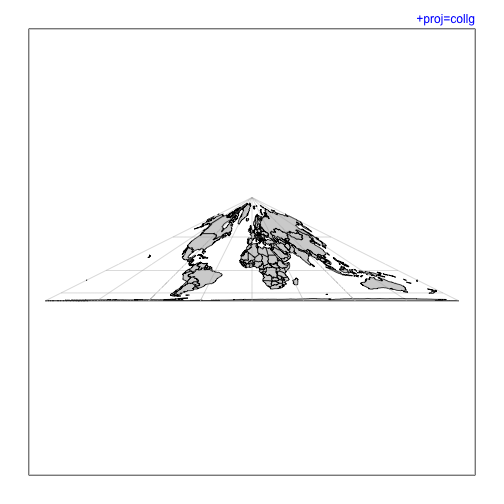
p <- "+proj=collg"
mapPlot(coastlineWorld, projection=p, col=col)
mtext(p, line=line, adj=1, col=pcol, font=font)
1
2
3
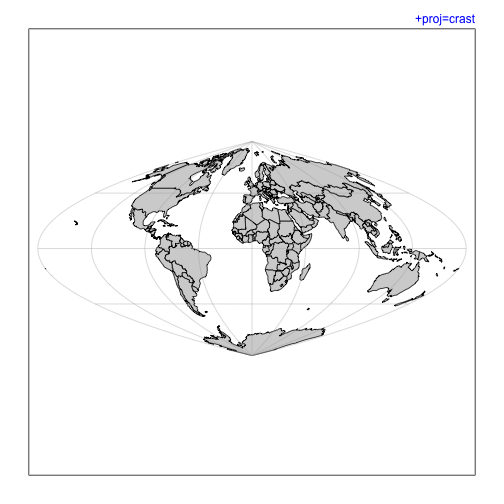
p <- "+proj=crast"
mapPlot(coastlineWorld, projection=p, col=col)
mtext(p, line=line, adj=1, col=pcol, font=font)
1
2
3
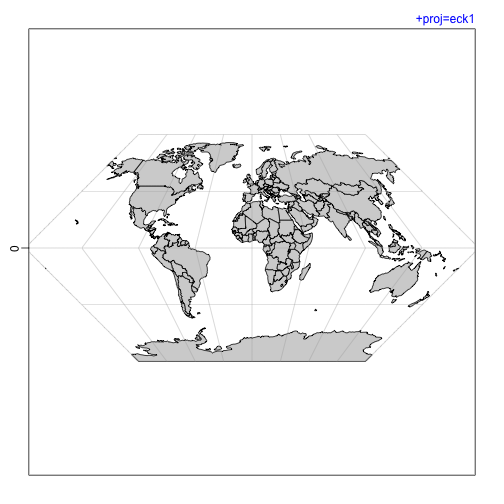
p <- "+proj=eck1"
mapPlot(coastlineWorld, projection=p, col=col)
mtext(p, line=line, adj=1, col=pcol, font=font)
1
2
3
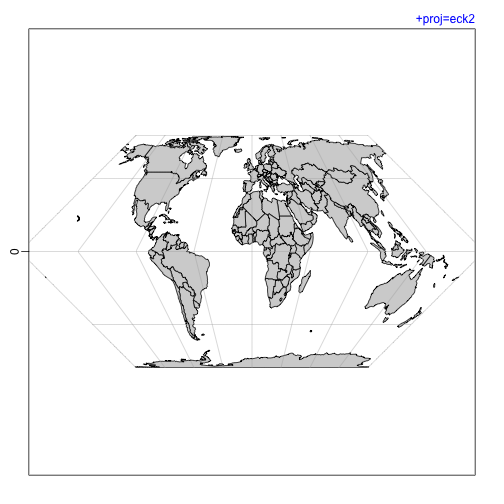
p <- "+proj=eck2"
mapPlot(coastlineWorld, projection=p, col=col)
mtext(p, line=line, adj=1, col=pcol, font=font)
1
2
3
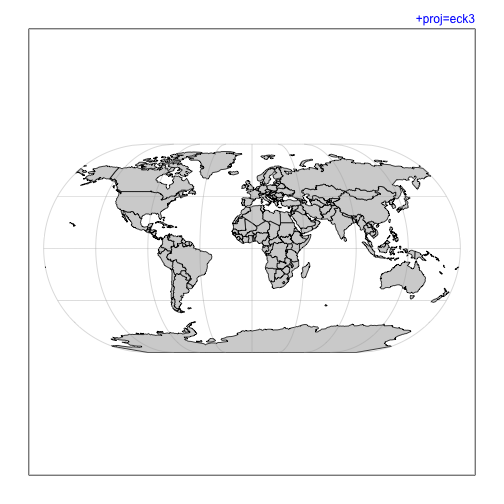
p <- "+proj=eck3"
mapPlot(coastlineWorld, projection=p, col=col)
mtext(p, line=line, adj=1, col=pcol, font=font)
1
2
3
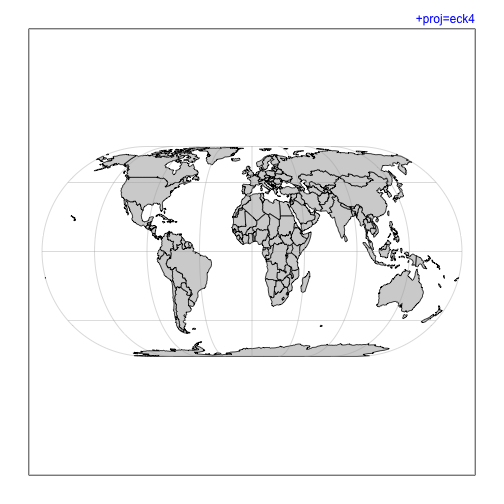
p <- "+proj=eck4"
mapPlot(coastlineWorld, projection=p, col=col)
mtext(p, line=line, adj=1, col=pcol, font=font)
1
2
3
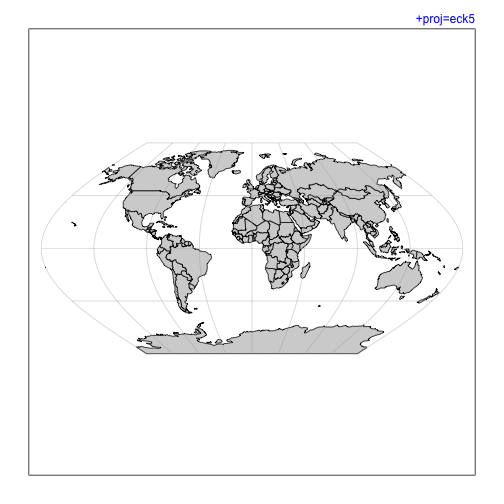
p <- "+proj=eck5"
mapPlot(coastlineWorld, projection=p, col=col)
mtext(p, line=line, adj=1, col=pcol, font=font)
1
2
3
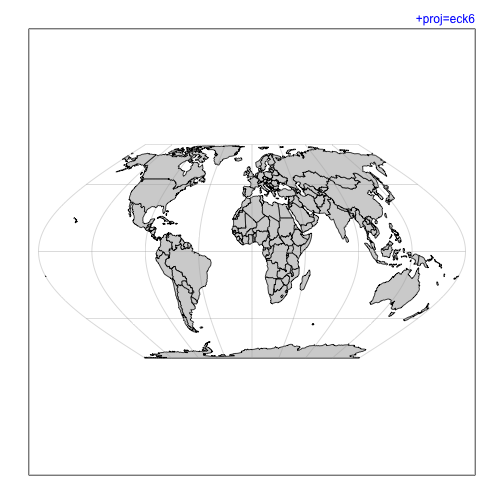
p <- "+proj=eck6"
mapPlot(coastlineWorld, projection=p, col=col)
mtext(p, line=line, adj=1, col=pcol, font=font)
1
2
3
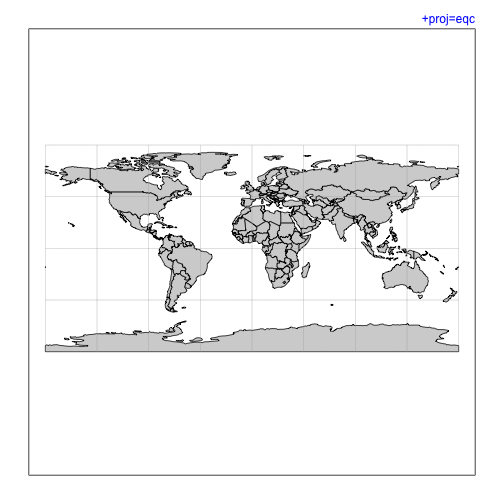
p <- "+proj=eqc"
mapPlot(coastlineWorld, projection=p, col=col)
mtext(p, line=line, adj=1, col=pcol, font=font)
1
2
3
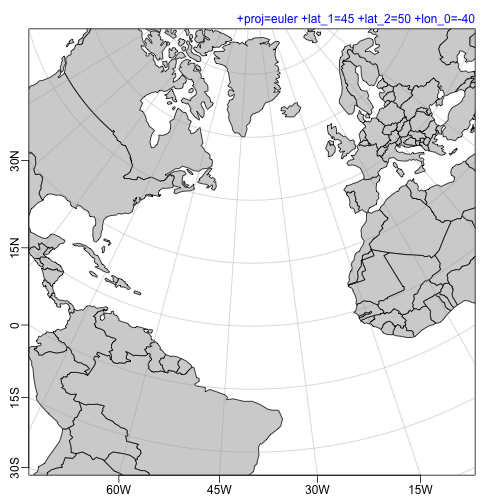
p <- "+proj=euler +lat_1=45 +lat_2=50 +lon_0=-40"
mapPlot(coastlineWorld, projection=p, longitudelim=c(-80, 0), latitudelim=c(0, 60), col=col)
mtext(p, line=line, adj=1, col=pcol, font=font)
1
2
3
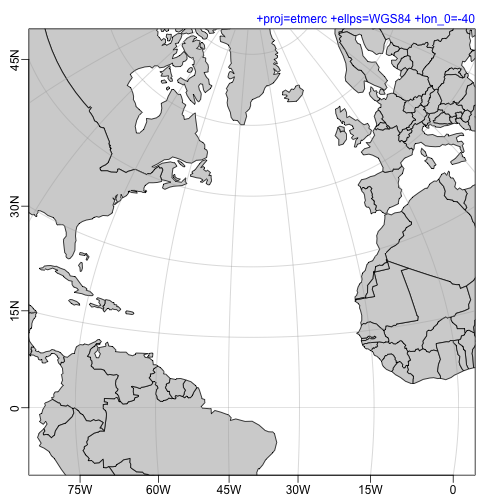
p <- "+proj=etmerc +ellps=WGS84 +lon_0=-40"
mapPlot(coastlineWorld, projection=p, longitudelim=c(-80, 0), latitudelim=c(0, 60), col=col)
mtext(p, line=line, adj=1, col=pcol, font=font)
1
2
3
4
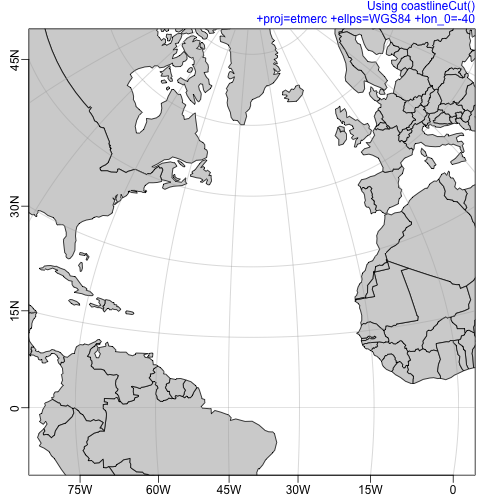
p <- "+proj=etmerc +ellps=WGS84 +lon_0=-40"
mapPlot(cl45, projection=p, longitudelim=c(-80, 0), latitudelim=c(0, 60), col=col)
mtext(p, line=line, adj=1, col=pcol, font=font)
mtext("Using coastlineCut()", line=line+0.9, adj=1, col=pcol, font=font)
1
2
3
4
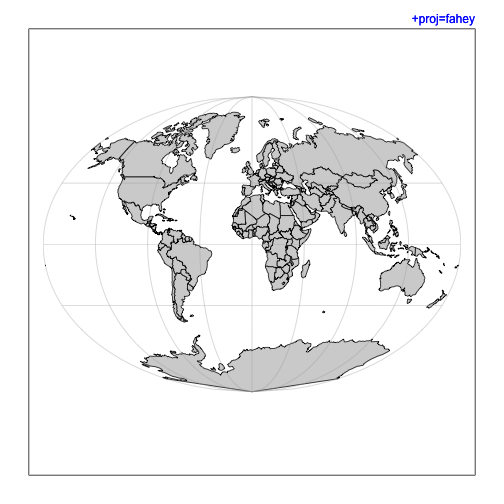
p <- "+proj=fahey"
mapPlot(coastlineWorld, projection=p, col=col)
mtext("+proj=fahey", line=line, adj=1, col=pcol, font=font)
mtext(p, line=line, adj=1, col=pcol, font=font)
1
2
3
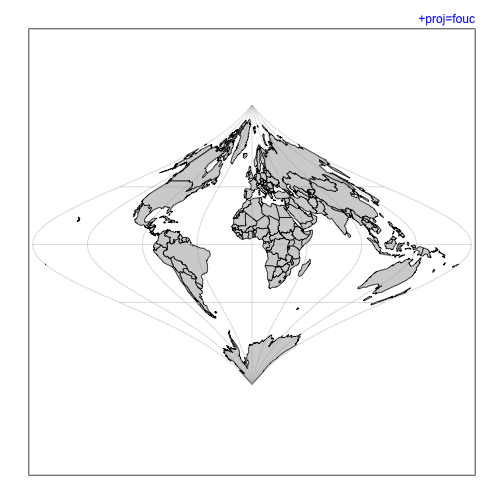
p <- "+proj=fouc"
mapPlot(coastlineWorld, projection=p, col=col)
mtext(p, line=line, adj=1, col=pcol, font=font)
1
2
3
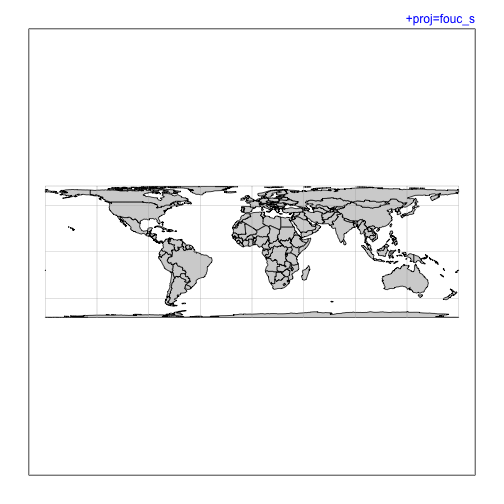
p <- "+proj=fouc_s"
mapPlot(coastlineWorld, projection=p, col=col)
mtext(p, line=line, adj=1, col=pcol, font=font)
1
2
3
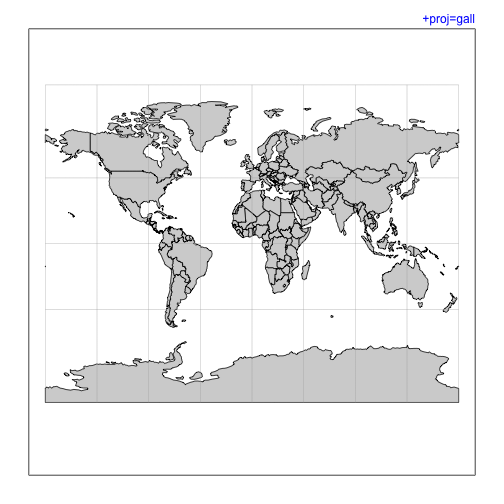
p <- "+proj=gall"
mapPlot(coastlineWorld, projection=p, col=col)
mtext(p, line=line, adj=1, col=pcol, font=font)
1
2
3
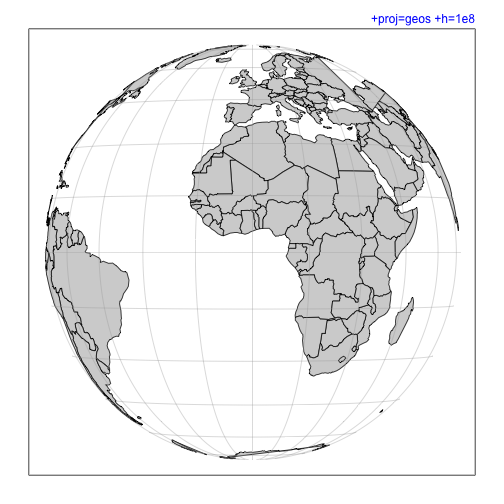
p <- "+proj=geos +h=1e8"
mapPlot(coastlineWorld, projection=p, col=col)
mtext(p, line=line, adj=1, col=pcol, font=font)
1
2
3
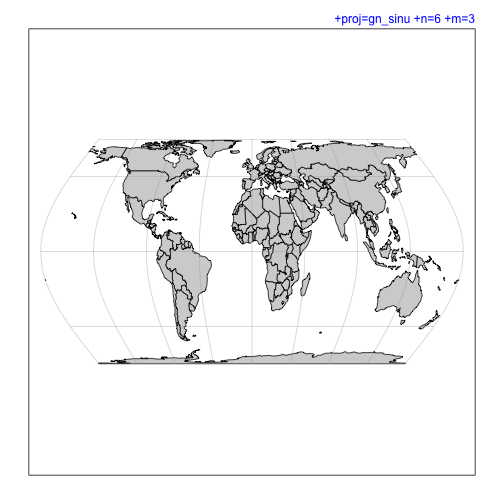
p <- "+proj=gn_sinu +n=6 +m=3"
mapPlot(coastlineWorld, projection=p, col=col)
mtext(p, line=line, adj=1, col=pcol, font=font)
1
2
3
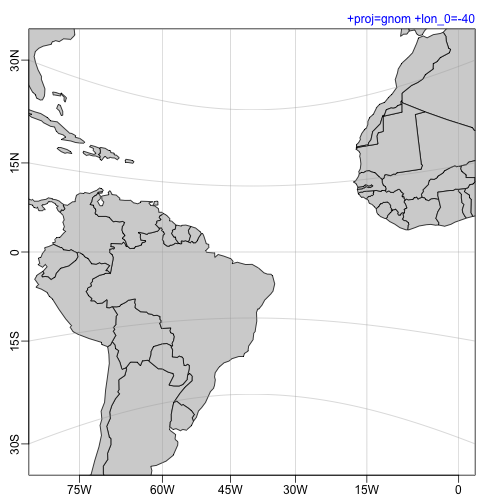
p <- "+proj=gnom +lon_0=-40"
mapPlot(coastlineWorld, projection=p, longitudelim=c(-80,0), latitudelim=c(-30,30), col=col)
mtext(p, line=line, adj=1, col=pcol, font=font)
1
2
3
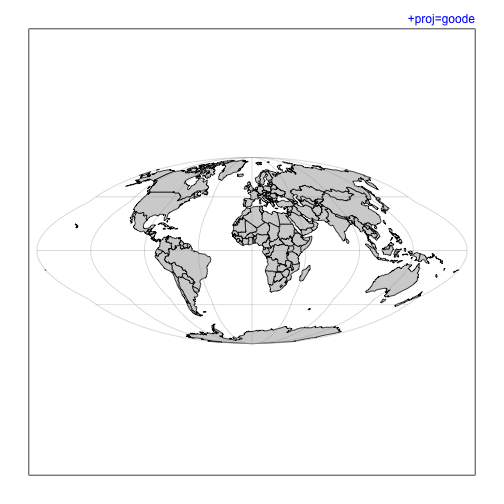
p <- "+proj=goode"
mapPlot(coastlineWorld, projection=p, col=col)
mtext(p, line=line, adj=1, col=pcol, font=font)
1
2
3
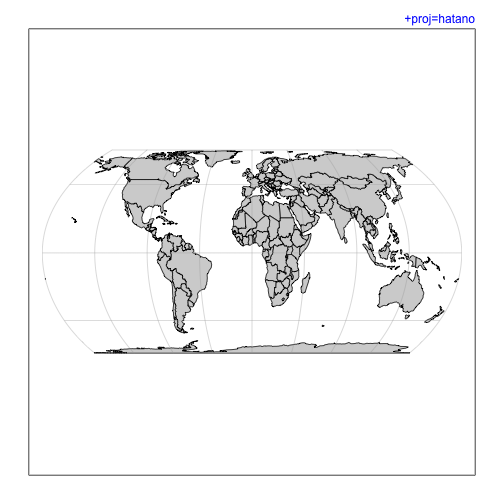
p <- "+proj=hatano"
mapPlot(coastlineWorld, projection=p, col=col)
mtext(p, line=line, adj=1, col=pcol, font=font)
1
2
3
4
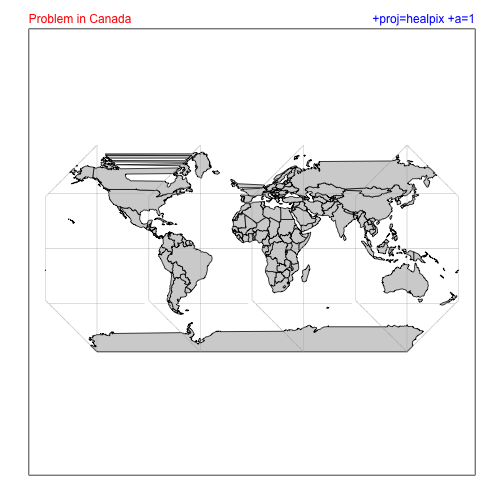
p <- "+proj=healpix +a=1"
mapPlot(coastlineWorld, projection=p, col=col)
mtext(p, line=line, adj=1, col=pcol, font=font)
mtext("Problem in Canada", line=line, adj=0, col=ecol, font=font)
1
2
3
4
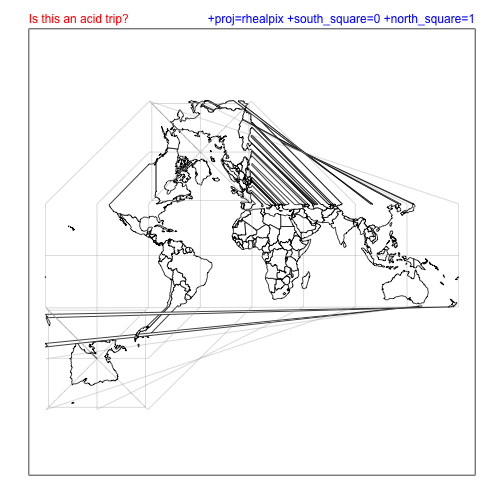
p <- "+proj=rhealpix +south_square=0 +north_square=1"
mapPlot(coastlineWorld, projection=p)
mtext(p, line=line, adj=1, col=pcol, font=font)
mtext("Is this an acid trip?", line=line, adj=0, col=ecol, font=font)
1
2
3
4
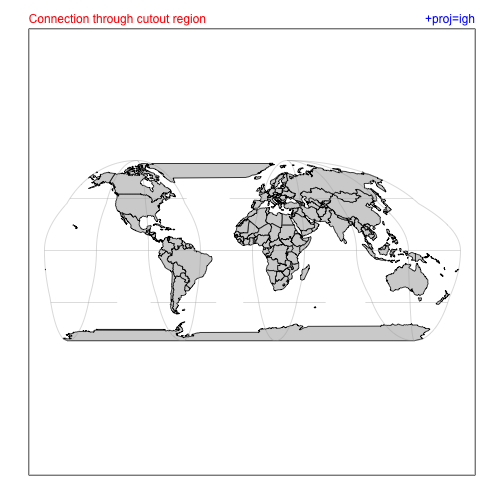
p <- "+proj=igh"
mapPlot(coastlineWorld, projection=p, col=col)
mtext(p, line=line, adj=1, col=pcol, font=font)
mtext("Connection through cutout region", line=line, adj=0, col=ecol, font=font)
1
2
3
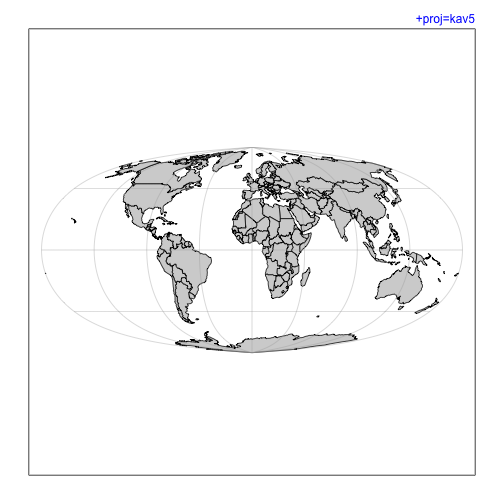
p <- "+proj=kav5"
mapPlot(coastlineWorld, projection=p, col=col)
mtext(p, line=line, adj=1, col=pcol, font=font)
1
2
3
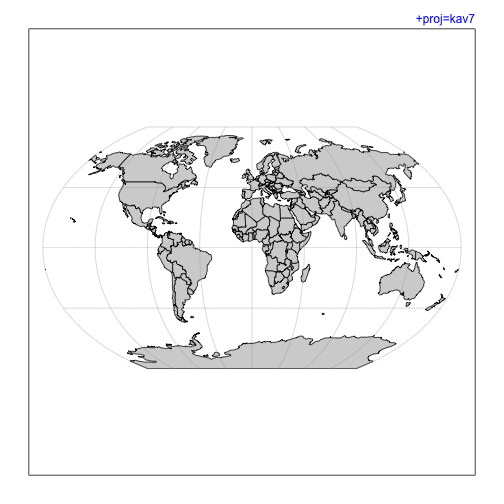
p <- "+proj=kav7"
mapPlot(coastlineWorld, projection=p, col=col)
mtext(p, line=line, adj=1, col=pcol, font=font)
1
2
3
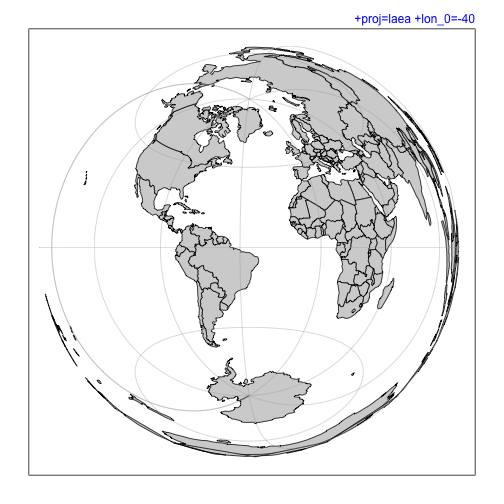
p <- "+proj=laea +lon_0=-40"
mapPlot(coastlineWorld, projection=p, col=col)
mtext("+proj=laea +lon_0=-40", line=line, adj=1, col=pcol, font=font)
1
2
3
p <- "+proj=longlat"
mapPlot(coastlineWorld, projection=p, col=col)
mtext("+proj=lonlat", line=line, adj=1, col=pcol, font=font)
1
2
3
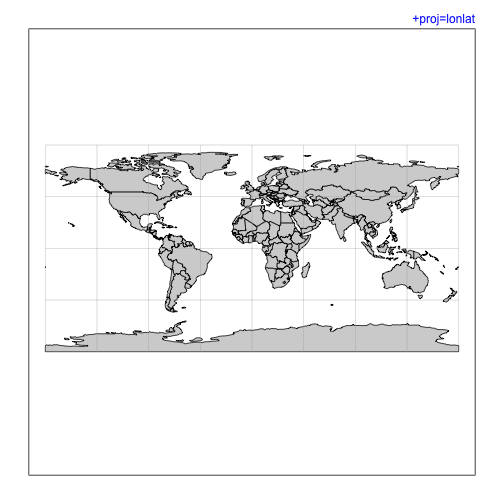
p <- "+proj=latlong"
mapPlot(coastlineWorld, projection=p, col=col)
mtext("+proj=lonlat", line=line, adj=1, col=pcol, font=font)
1
2
3
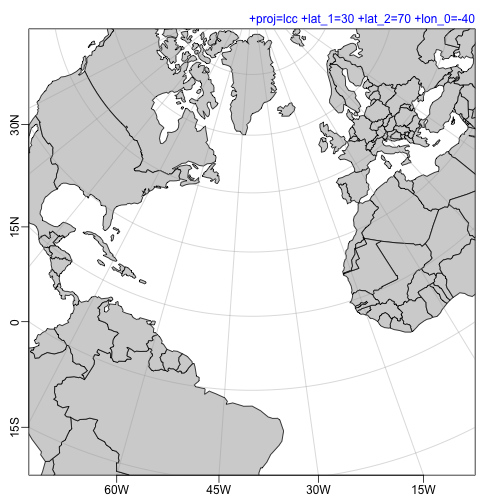
p <- "+proj=lcc +lat_1=30 +lat_2=70 +lon_0=-40"
mapPlot(coastlineWorld, projection=p, longitudelim=c(-80, 0), latitudelim=c(0, 60), col=col)
mtext(p, line=line, adj=1, col=pcol, font=font)
1
2
3
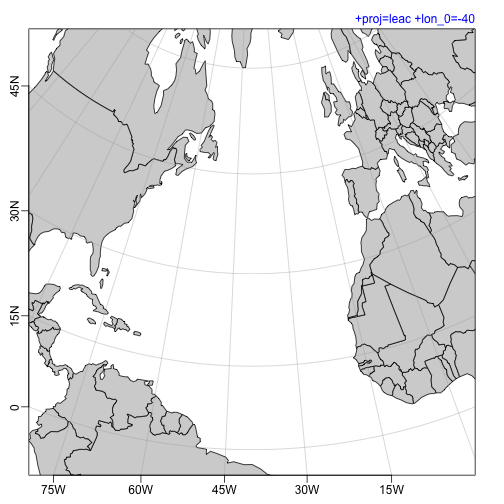
p <- "+proj=leac +lon_0=-40"
mapPlot(coastlineWorld, projection=p, longitudelim=c(-80, 0), latitudelim=c(0, 60), col=col)
mtext(p, line=line, adj=1, col=pcol, font=font)
1
2
3
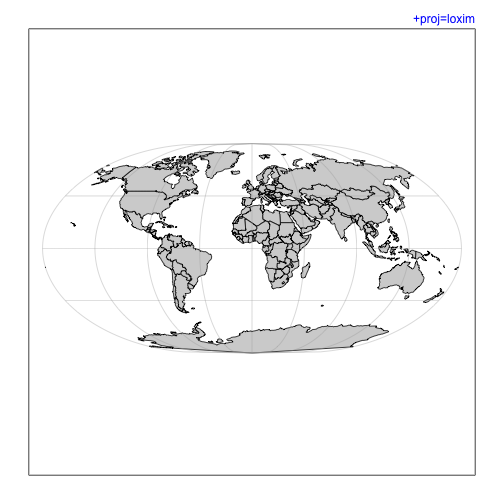
p <- "+proj=loxim"
mapPlot(coastlineWorld, projection=p, col=col)
mtext(p, line=line, adj=1, col=pcol, font=font)
1
2
3
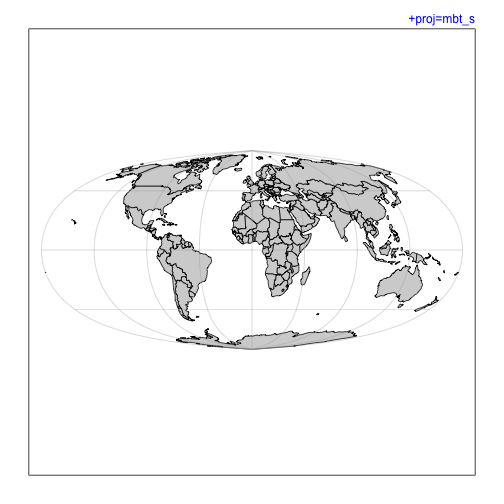
p <- "+proj=mbt_s"
mapPlot(coastlineWorld, projection=p, col=col)
mtext(p, line=line, adj=1, col=pcol, font=font)
1
2
3
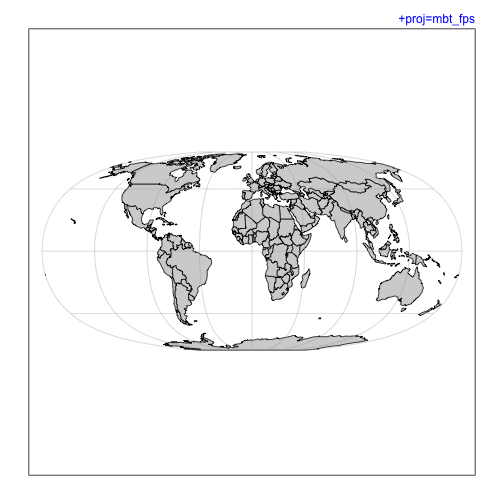
p <- "+proj=mbt_fps"
mapPlot(coastlineWorld, projection=p, col=col)
mtext(p, line=line, adj=1, col=pcol, font=font)
1
2
3
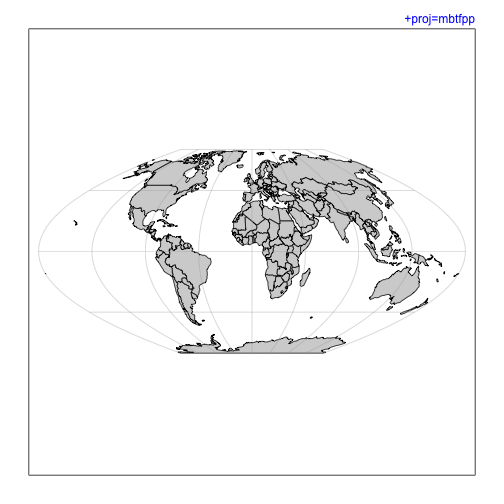
p <- "+proj=mbtfpp"
mapPlot(coastlineWorld, projection=p, col=col)
mtext(p, line=line, adj=1, col=pcol, font=font)
1
2
3
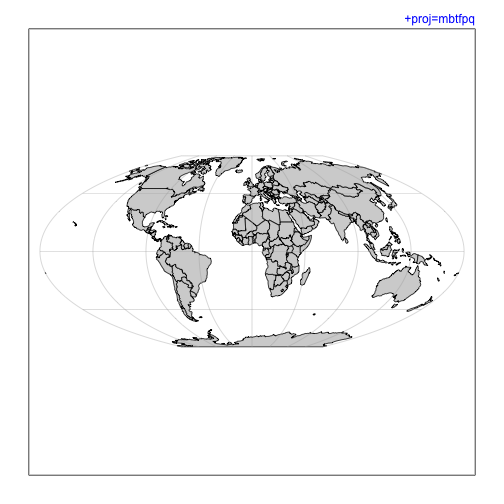
p <- "+proj=mbtfpq"
mapPlot(coastlineWorld, projection=p, col=col)
mtext(p, line=line, adj=1, col=pcol, font=font)
1
2
3
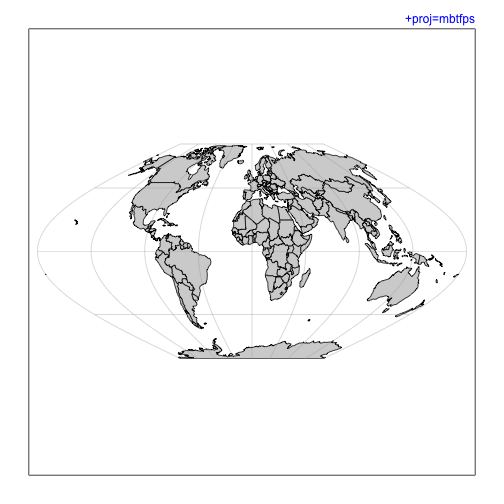
p <- "+proj=mbtfps"
mapPlot(coastlineWorld, projection=p, col=col)
mtext(p, line=line, adj=1, col=pcol, font=font)
1
2
3
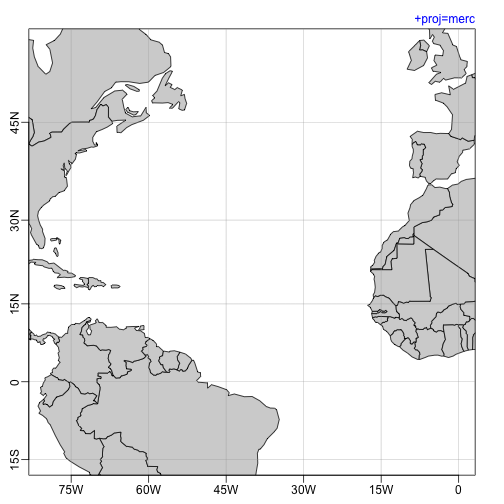
p <- "+proj=merc"
mapPlot(coastlineWorld, projection=p, longitudelim=c(-80,0), latitudelim=c(0,45), col=col)
mtext(p, line=line, adj=1, col=pcol, font=font)
1
2
3
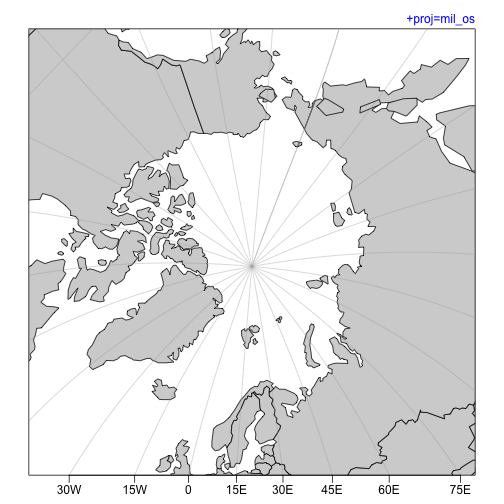
p <- "+proj=mil_os"
mapPlot(coastlineWorld, projection=p, longitudelim=c(-80,0), latitudelim=c(70, 120), col=col)
mtext(p, line=line, adj=1, col=pcol, font=font)
1
2
3
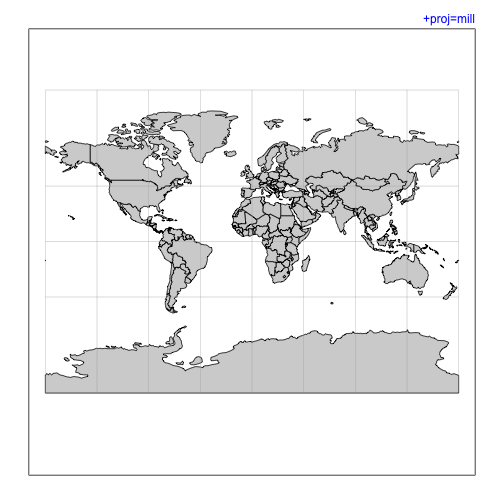
p <- "+proj=mill"
mapPlot(coastlineWorld, projection=p, col=col)
mtext(p, line=line, adj=1, col=pcol, font=font)
1
2
3
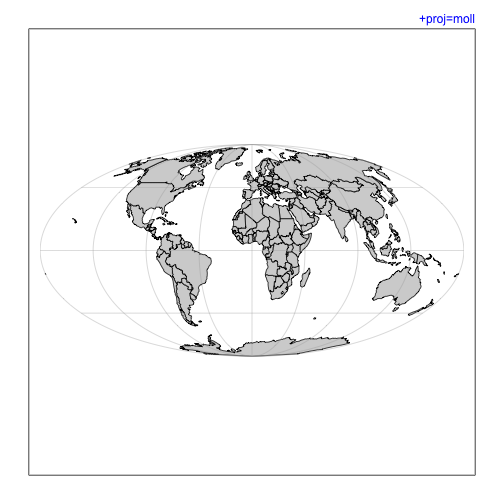
p <- "+proj=moll"
mapPlot(coastlineWorld, projection=p, col=col)
mtext(p, line=line, adj=1, col=pcol, font=font)
1
2
3
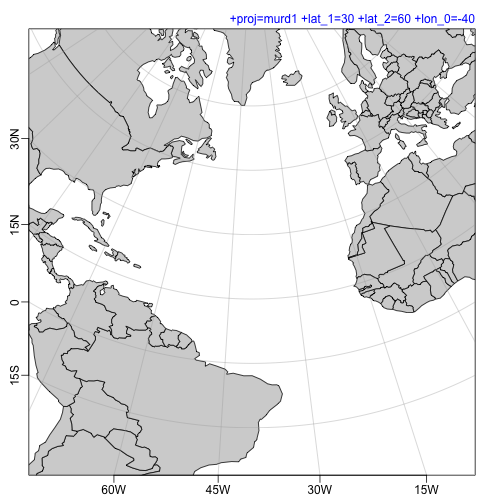
p <- "+proj=murd1 +lat_1=30 +lat_2=60 +lon_0=-40"
mapPlot(coastlineWorld, projection=p, longitudelim=c(-80,0), latitudelim=c(0,45), col=col)
mtext(p, line=line, adj=1, col=pcol, font=font)
1
2
3
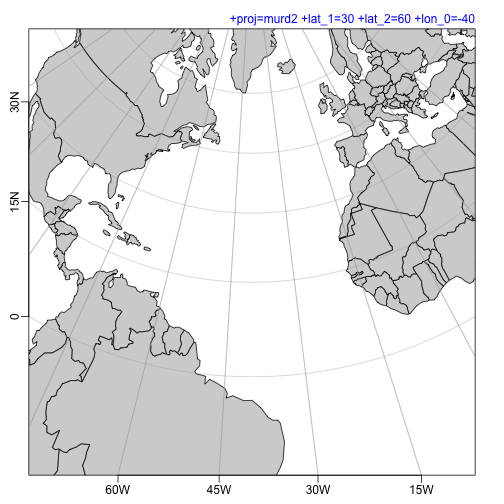
p <- "+proj=murd2 +lat_1=30 +lat_2=60 +lon_0=-40"
mapPlot(coastlineWorld, projection=p, longitudelim=c(-80,0), latitudelim=c(0,45), col=col)
mtext(p, line=line, adj=1, col=pcol, font=font)
1
2
3
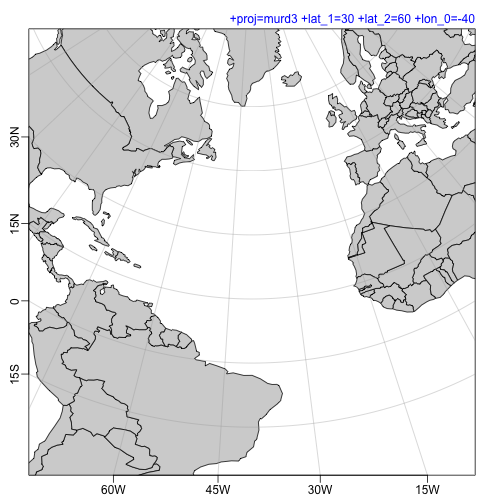
p <- "+proj=murd3 +lat_1=30 +lat_2=60 +lon_0=-40"
mapPlot(coastlineWorld, projection=p, longitudelim=c(-80,0), latitudelim=c(0,45), col=col)
mtext(p, line=line, adj=1, col=pcol, font=font)
1
2
3
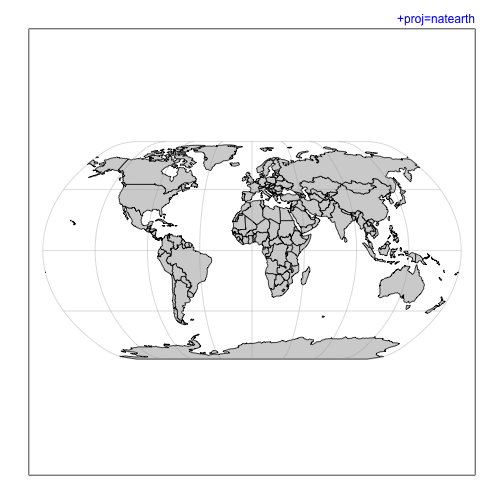
p <- "+proj=natearth"
mapPlot(coastlineWorld, projection=p, col=col)
mtext(p, line=line, adj=1, col=pcol, font=font)
1
2
3
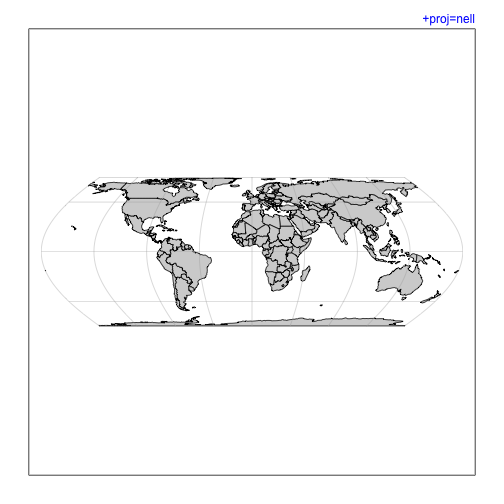
p <- "+proj=nell"
mapPlot(coastlineWorld, projection=p, col=col)
mtext(p, line=line, adj=1, col=pcol, font=font)
1
2
3
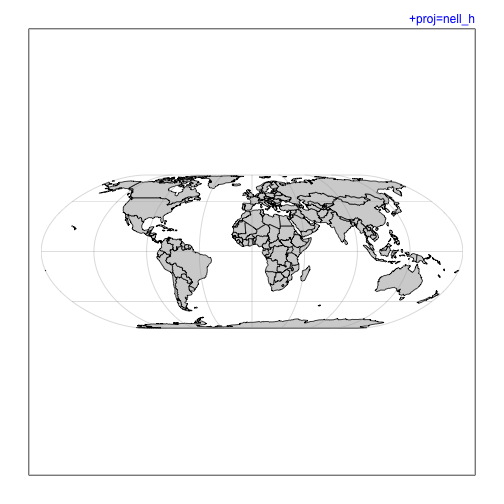
p <- "+proj=nell_h"
mapPlot(coastlineWorld, projection=p, col=col)
mtext(p, line=line, adj=1, col=pcol, font=font)
1
2
3
4
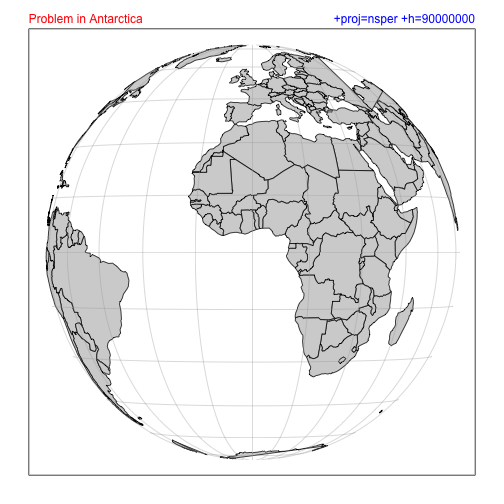
p <- "+proj=nsper +h=90000000"
mapPlot(coastlineWorld, projection=p, col=col)
mtext(p, line=line, adj=1, col=pcol, font=font)
mtext("Problem in Antarctica", line=line, adj=0, col=ecol, font=font)
1
2
3
4
5
6
p <- "+proj=ob_tran"
## mapPlot(coastlineWorld, projection=p, longitudelim=c(-180,-120), latitudelim=c(-50,-20), col=col)
plot(0:1, 0:1, axes=FALSE, type='n', xlab="", ylab="")
box()
mtext(p, line=line, adj=1, col=pcol, font=font)
mtext("Usage?", line=line, adj=0, col=ecol, font=font)

1
2
3
4
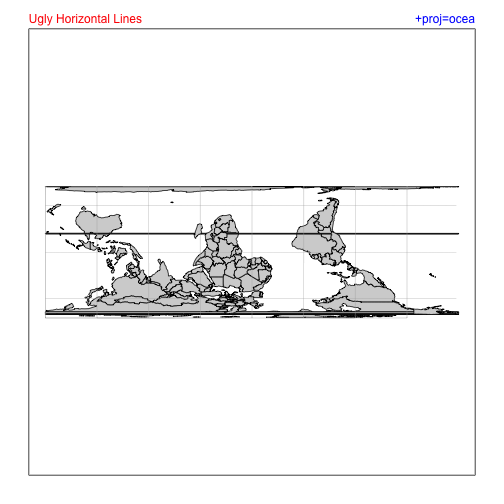
p <- "+proj=ocea"
mapPlot(coastlineWorld, projection=p, col=col)
mtext(p, line=line, adj=1, col=pcol, font=font)
mtext("Ugly Horizontal Lines", line=line, adj=0, col=ecol, font=font)
1
2
3
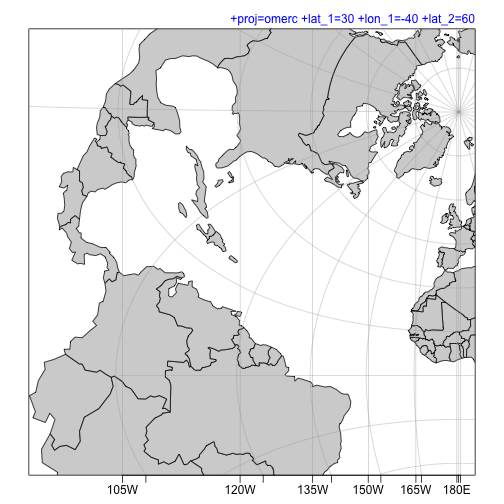
p <- "+proj=omerc +lat_1=30 +lon_1=-40 +lat_2=60"
mapPlot(coastlineWorld, projection=p, longitudelim=c(-80,0), latitudelim=c(0,60), col=col)
mtext(p, line=line, adj=1, col=pcol, font=font)
1
2
3
4
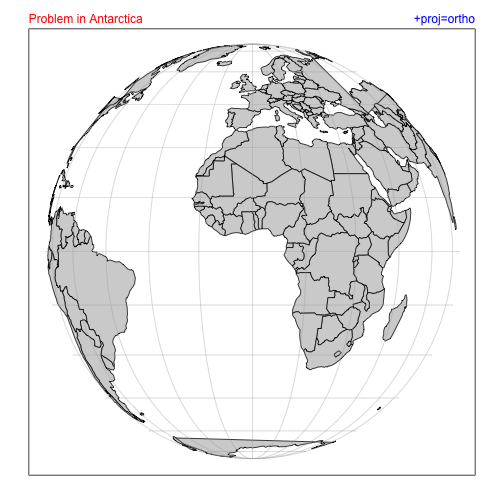
p <- "+proj=ortho"
mapPlot(coastlineWorld, projection=p, col=col)
mtext(p, line=line, adj=1, col=pcol, font=font)
mtext("Problem in Antarctica", line=line, adj=0, col=ecol, font=font)
1
2
3
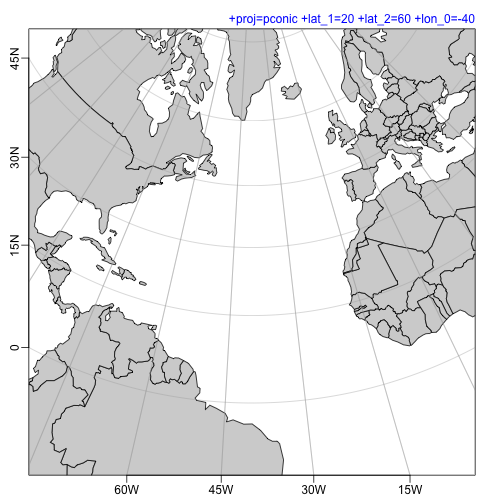
p <- "+proj=pconic +lat_1=20 +lat_2=60 +lon_0=-40"
mapPlot(coastlineWorld, projection=p, longitudelim=c(-80,0), latitudelim=c(0,60), col=col)
mtext(p, line=line, adj=1, col=pcol, font=font)
1
2
3
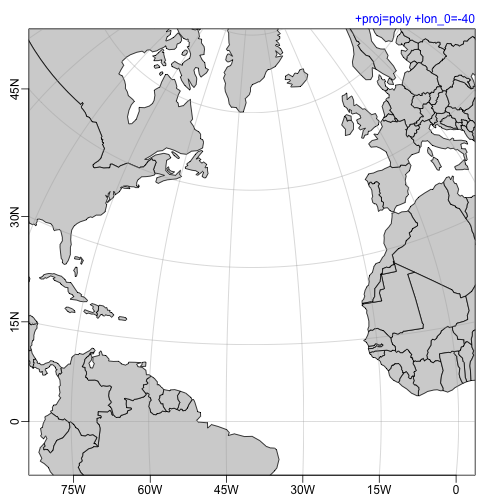
p <- "+proj=poly +lon_0=-40"
mapPlot(coastlineWorld, projection=p, longitudelim=c(-80,0), latitudelim=c(0,60), col=col)
mtext(p, line=line, adj=1, col=pcol, font=font)
1
2
3
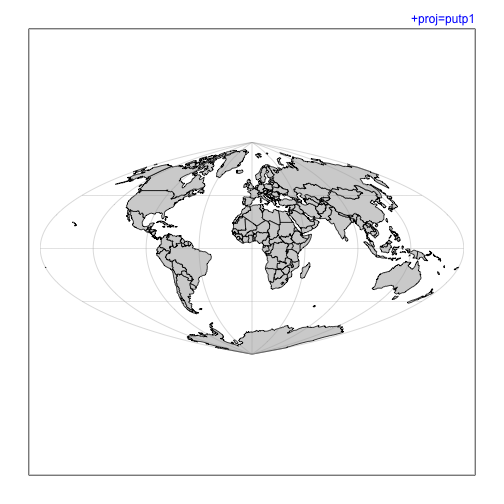
p <- "+proj=putp1"
mapPlot(coastlineWorld, projection=p, col=col)
mtext(p, line=line, adj=1, col=pcol, font=font)
1
2
3
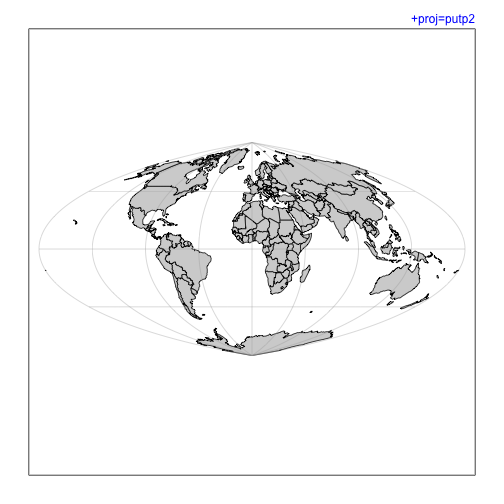
p <- "+proj=putp2"
mapPlot(coastlineWorld, projection=p, col=col)
mtext(p, line=line, adj=1, col=pcol, font=font)
1
2
3
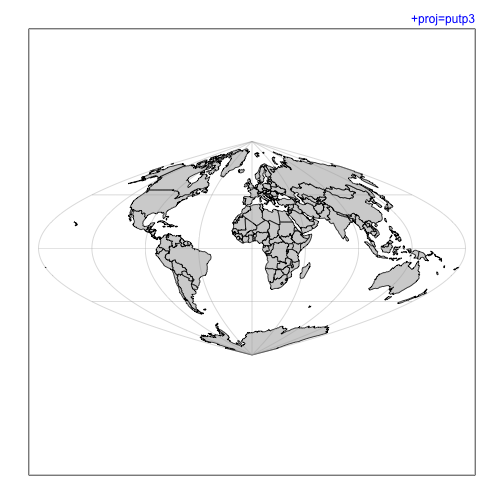
p <- "+proj=putp3"
mapPlot(coastlineWorld, projection=p, col=col)
mtext(p, line=line, adj=1, col=pcol, font=font)
1
2
3
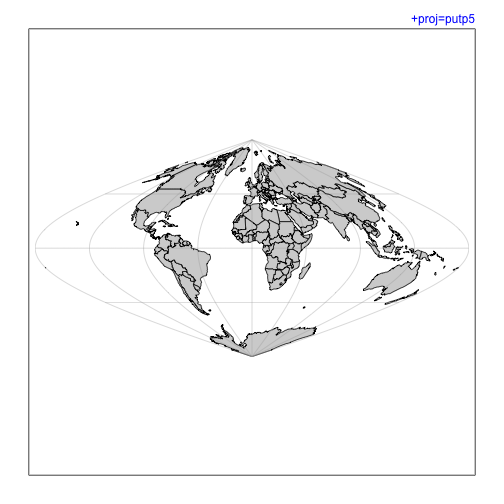
p <- "+proj=putp5"
mapPlot(coastlineWorld, projection=p, col=col)
mtext(p, line=line, adj=1, col=pcol, font=font)
1
2
3
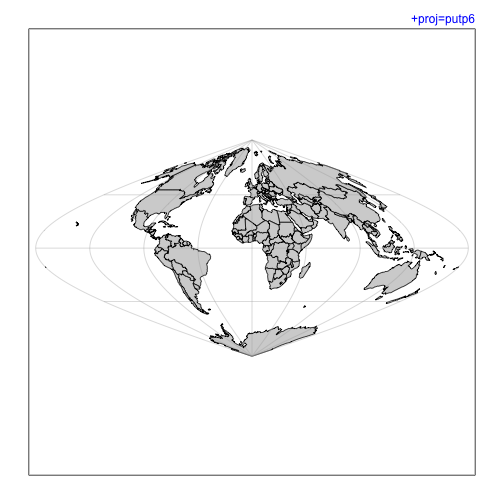
p <- "+proj=putp6"
mapPlot(coastlineWorld, projection=p, col=col)
mtext(p, line=line, adj=1, col=pcol, font=font)
1
2
3
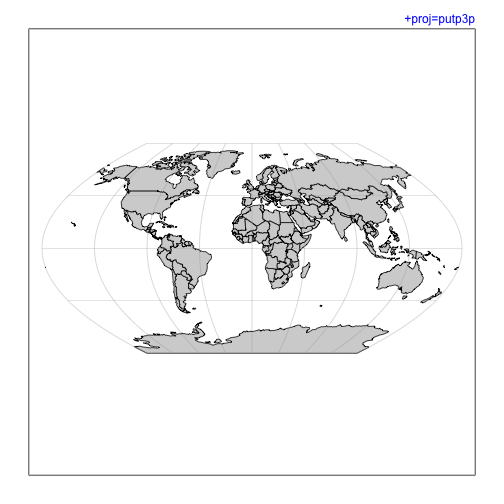
p <- "+proj=putp3p"
mapPlot(coastlineWorld, projection=p, col=col)
mtext(p, line=line, adj=1, col=pcol, font=font)
1
2
3
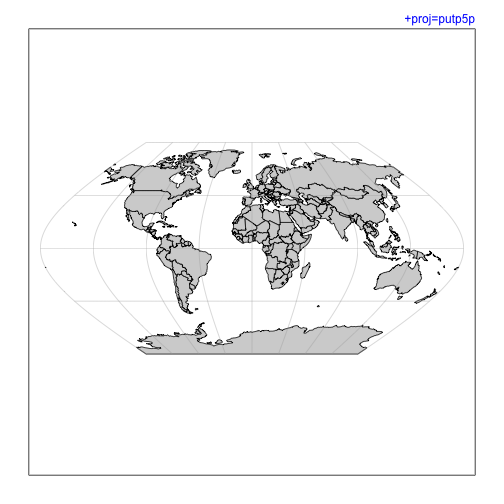
p <- "+proj=putp5p"
mapPlot(coastlineWorld, projection=p, col=col)
mtext(p, line=line, adj=1, col=pcol, font=font)
1
2
3
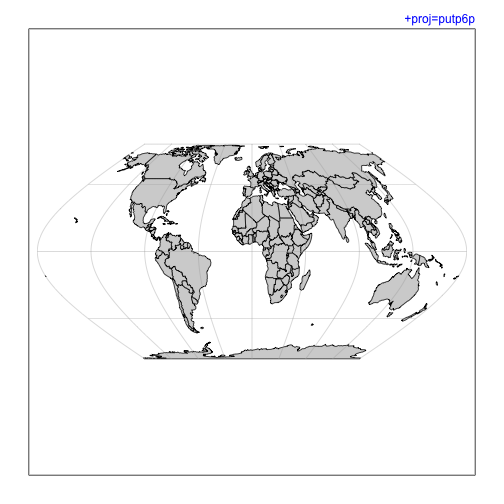
p <- "+proj=putp6p"
mapPlot(coastlineWorld, projection=p, col=col)
mtext(p, line=line, adj=1, col=pcol, font=font)
1
2
3
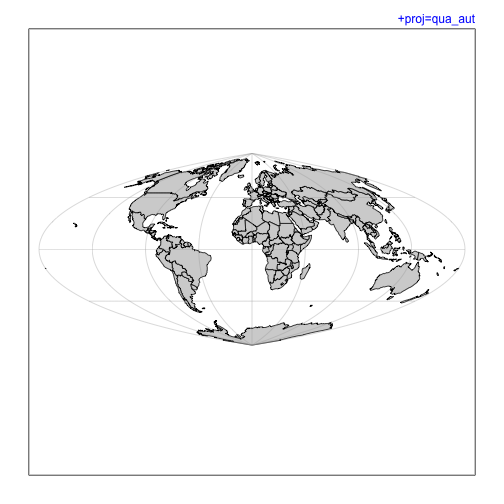
p <- "+proj=qua_aut"
mapPlot(coastlineWorld, projection=p, col=col)
mtext(p, line=line, adj=1, col=pcol, font=font)
1
2
3
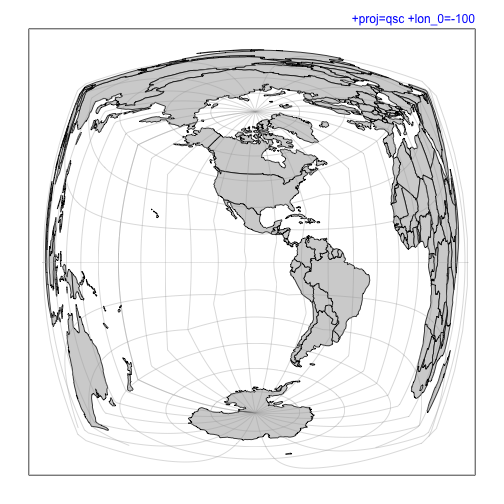
p <- "+proj=qsc +lon_0=-100"
mapPlot(coastlineWorld, projection=p, grid=15, col=col)
mtext(p, line=line, adj=1, col=pcol, font=font)
1
2
3
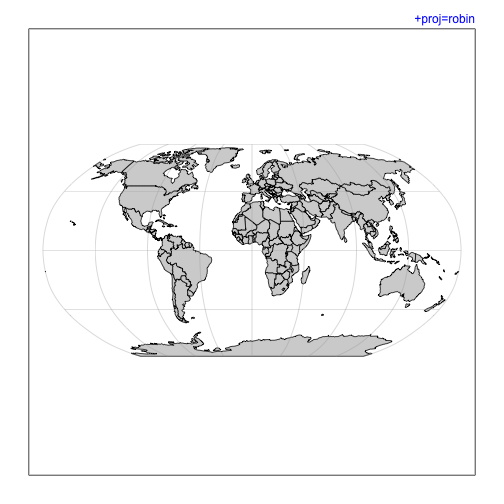
p <- "+proj=robin"
mapPlot(coastlineWorld, projection=p, col=col)
mtext(p, line=line, adj=1, col=pcol, font=font)
1
2
3
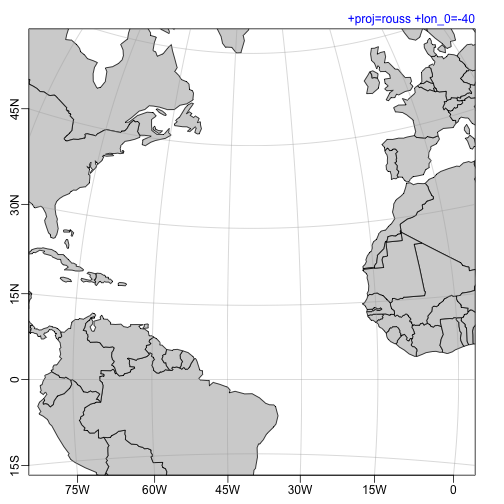
p <- "+proj=rouss +lon_0=-40"
mapPlot(coastlineWorld, projection=p, longitudelim=c(-80,0), latitudelim=c(0,45), col=col)
mtext(p, line=line, adj=1, col=pcol, font=font)
1
2
3
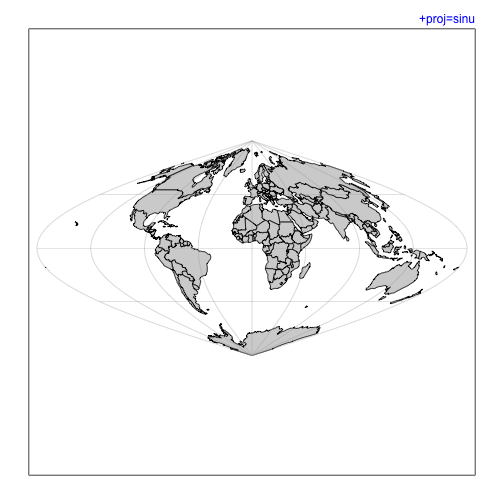
p <- "+proj=sinu"
mapPlot(coastlineWorld, projection=p, col=col)
mtext(p, line=line, adj=1, col=pcol, font=font)
1
2
3
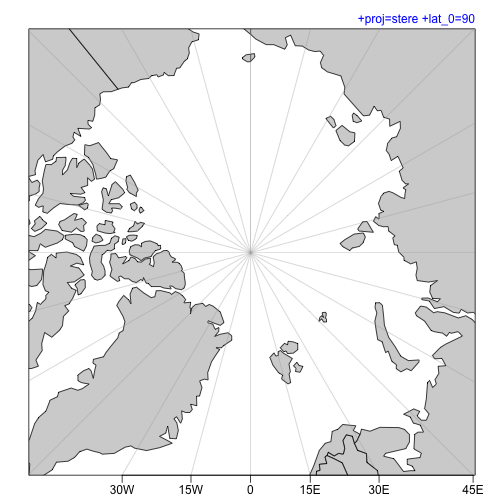
p <- "+proj=stere +lat_0=90"
mapPlot(coastlineWorld, projection=p, longitudelim=c(-80,0), latitudelim=c(70, 110), col=col)
mtext(p, line=line, adj=1, col=pcol, font=font)
1
2
3
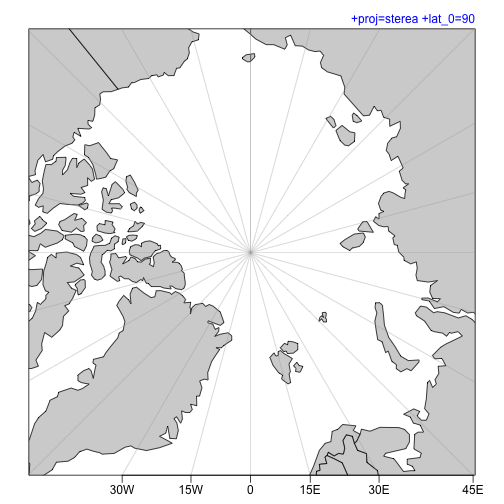
p <- "+proj=sterea +lat_0=90"
mapPlot(coastlineWorld, projection=p, longitudelim=c(-80,0), latitudelim=c(70, 110), col=col)
mtext(p, line=line, adj=1, col=pcol, font=font)
1
2
3
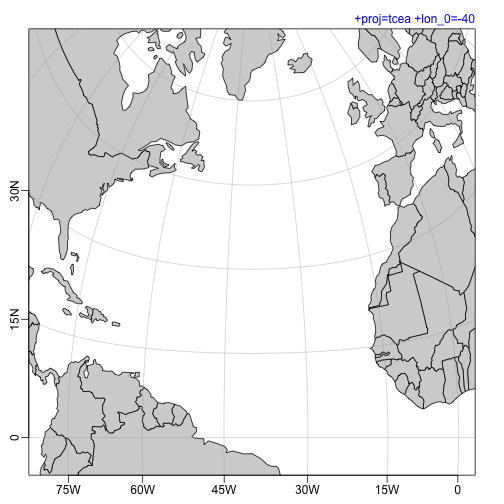
p <- "+proj=tcea +lon_0=-40"
mapPlot(coastlineWorld, projection=p, longitudelim=c(-80,0), latitudelim=c(0,60), col=col)
mtext(p, line=line, adj=1, col=pcol, font=font)
1
2
3
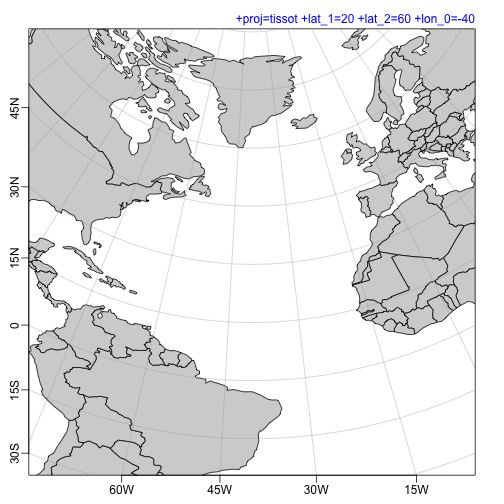
p <- "+proj=tissot +lat_1=20 +lat_2=60 +lon_0=-40"
mapPlot(coastlineWorld, projection=p, longitudelim=c(-80,0), latitudelim=c(0,60), col=col)
mtext(p, line=line, adj=1, col=pcol, font=font)
1
2
3
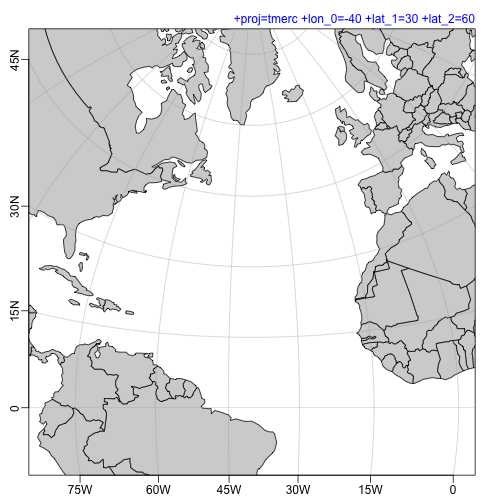
p <- "+proj=tmerc +lon_0=-40 +lat_1=30 +lat_2=60"
mapPlot(coastlineWorld, projection=p, longitudelim=c(-80,0), latitudelim=c(0,60), col=col)
mtext(p, line=line, adj=1, col=pcol, font=font)
1
2
3
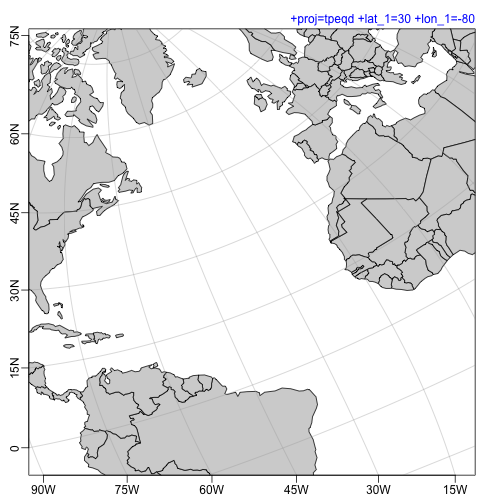
p <- "+proj=tpeqd +lat_1=30 +lon_1=-80"
mapPlot(coastlineWorld, projection=p, longitudelim=c(-80,0), latitudelim=c(0,60), col=col)
mtext(p, line=line, adj=1, col=pcol, font=font)
1
2
3
4
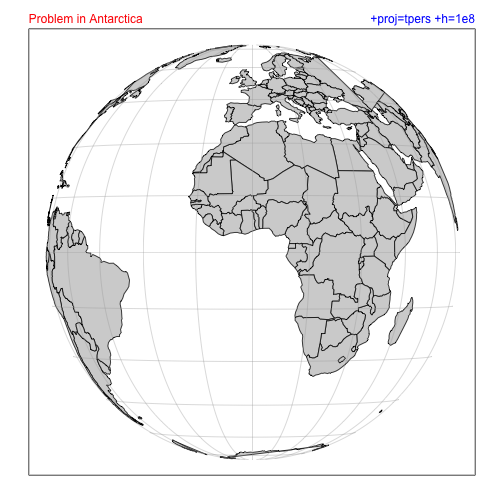
p <- "+proj=tpers +h=1e8"
mapPlot(coastlineWorld, projection=p, col=col)
mtext(p, line=line, adj=1, col=pcol, font=font)
mtext("Problem in Antarctica", line=line, adj=0, col=ecol, font=font)
1
2
3
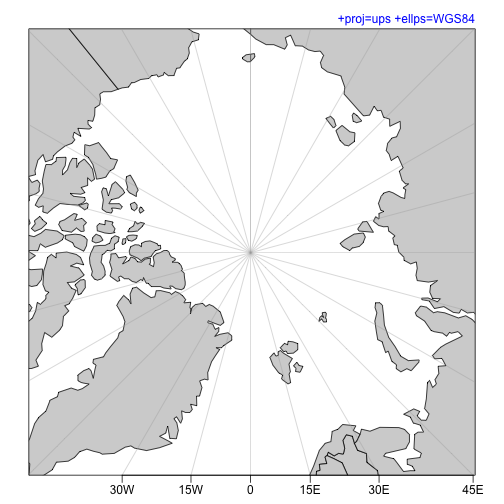
p <- "+proj=ups +ellps=WGS84"
mapPlot(coastlineWorld, projection=p, longitudelim=c(-80,0), latitudelim=c(70, 110), col=col)
mtext(p, line=line, adj=1, col=pcol, font=font)
1
2
3
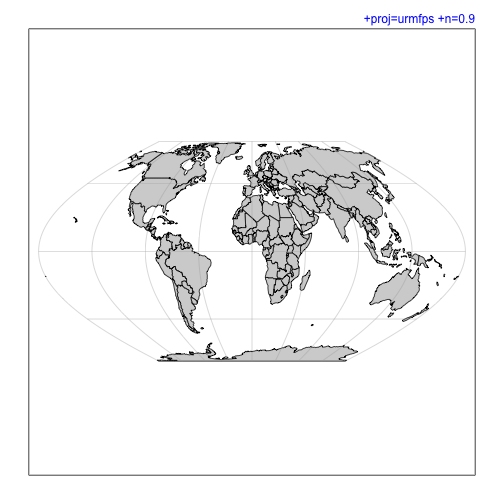
p <- "+proj=urmfps +n=0.9"
mapPlot(coastlineWorld, projection=p, col=col)
mtext(p, line=line, adj=1, col=pcol, font=font)
1
2
3
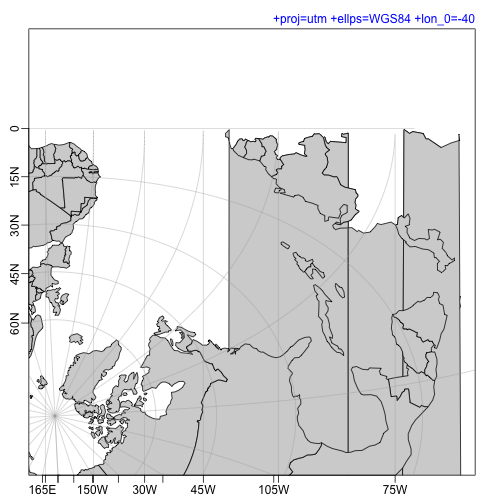
p <- "+proj=utm +ellps=WGS84 +lon_0=-40"
mapPlot(coastlineWorld, projection=p, longitudelim=c(-80,0), latitudelim=c(0,45), col=col)
mtext(p, line=line, adj=1, col=pcol, font=font)
1
2
3
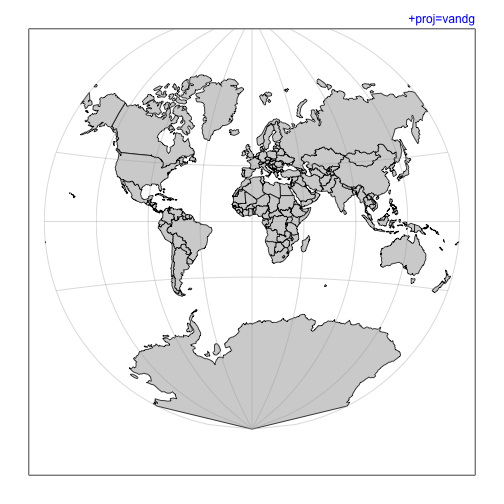
p <- "+proj=vandg"
mapPlot(coastlineWorld, projection=p, col=col)
mtext(p, line=line, adj=1, col=pcol, font=font)
1
2
3
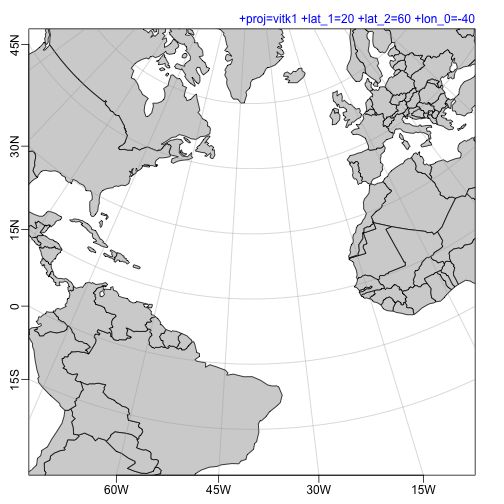
p <- "+proj=vitk1 +lat_1=20 +lat_2=60 +lon_0=-40"
mapPlot(coastlineWorld, projection=p, longitudelim=c(-80,0), latitudelim=c(0,45), col=col)
mtext(p, line=line, adj=1, col=pcol, font=font)
1
2
3
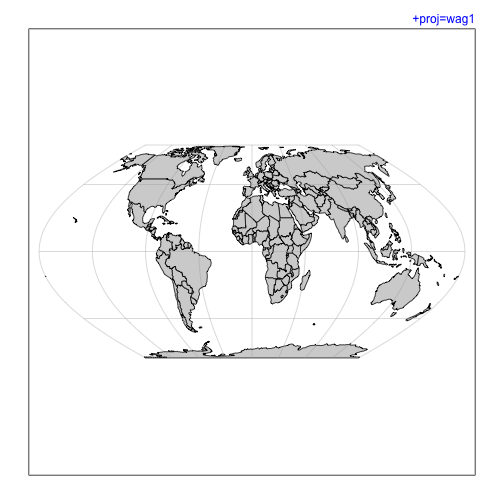
p <- "+proj=wag1"
mapPlot(coastlineWorld, projection=p, col=col)
mtext(p, line=line, adj=1, col=pcol, font=font)
1
2
3
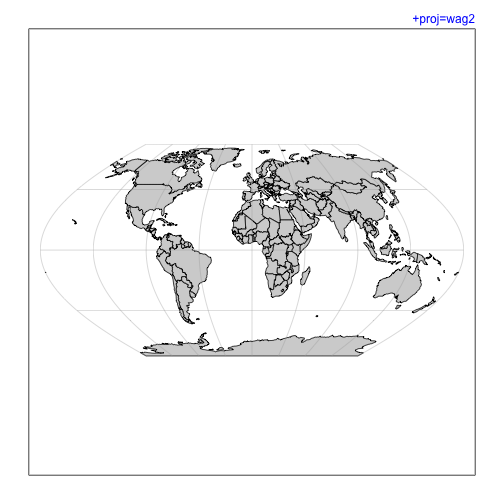
p <- "+proj=wag2"
mapPlot(coastlineWorld, projection=p, col=col)
mtext(p, line=line, adj=1, col=pcol, font=font)
1
2
3
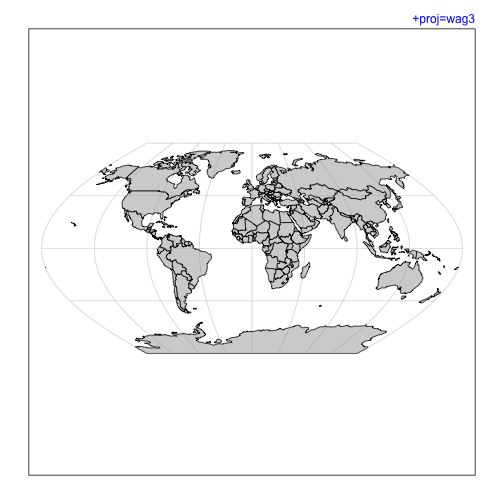
p <- "+proj=wag3"
mapPlot(coastlineWorld, projection=p, col=col)
mtext(p, line=line, adj=1, col=pcol, font=font)
1
2
3
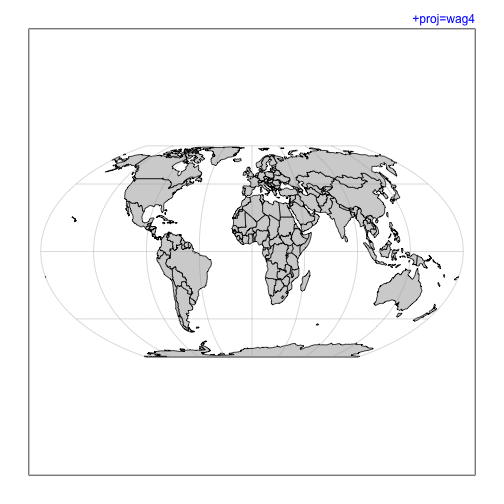
p <- "+proj=wag4"
mapPlot(coastlineWorld, projection=p, col=col)
mtext(p, line=line, adj=1, col=pcol, font=font)
1
2
3
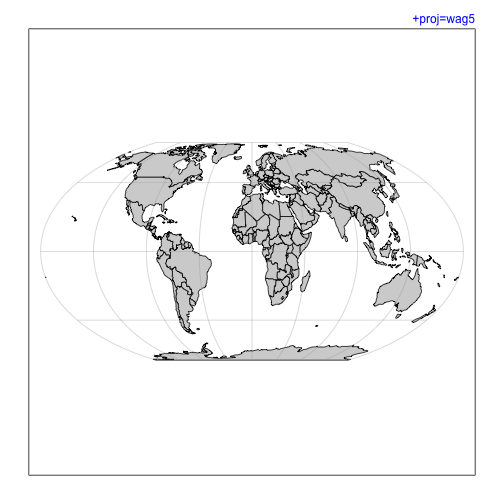
p <- "+proj=wag5"
mapPlot(coastlineWorld, projection=p, col=col)
mtext(p, line=line, adj=1, col=pcol, font=font)
1
2
3
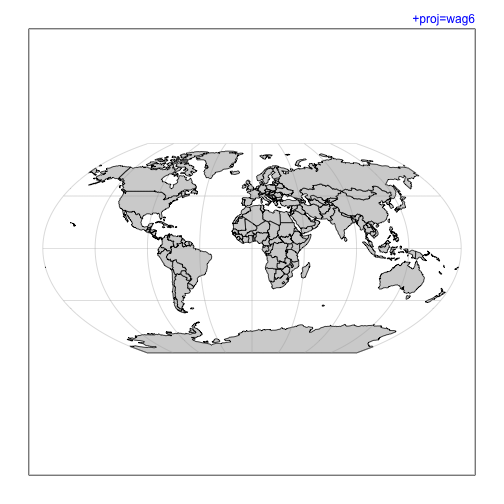
p <- "+proj=wag6"
mapPlot(coastlineWorld, projection=p, col=col)
mtext(p, line=line, adj=1, col=pcol, font=font)
1
2
3
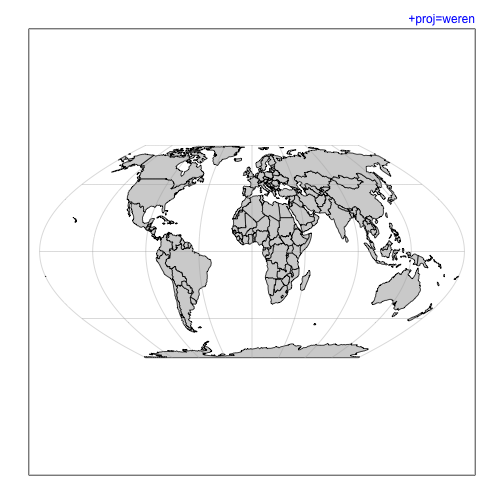
p <- "+proj=weren"
mapPlot(coastlineWorld, projection=p, col=col)
mtext(p, line=line, adj=1, col=pcol, font=font)
1
2
3
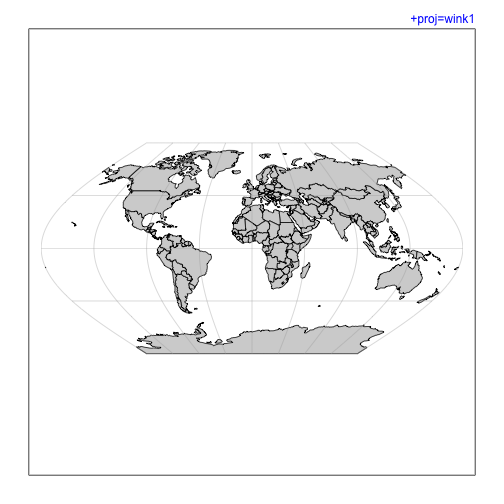
p <- "+proj=wink1"
mapPlot(coastlineWorld, projection=p, col=col)
mtext(p, line=line, adj=1, col=pcol, font=font)
1
2
3
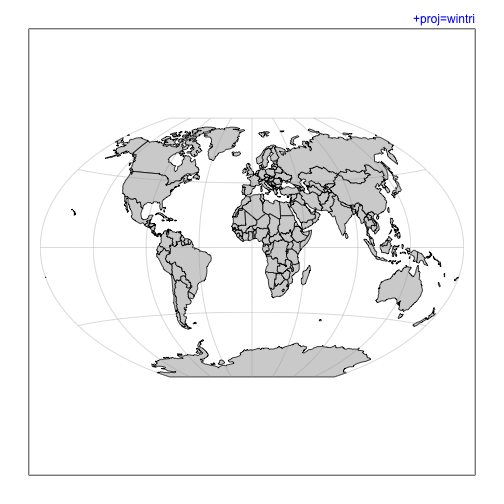
p <- "+proj=wintri"
mapPlot(coastlineWorld, projection=p, col=col)
mtext(p, line=line, adj=1, col=pcol, font=font)
References and resources
-
Jekyll source code for this blog entry: 2020-01-04-oce-proj.Rmd