The problem of R colours (before version 4.x)
It can be very handy to use numeric colours in R, to distinguish graphical features. Commonly, I write something like
1
2
3
# Not run here, so no graph
plot(x, y1)
points(x, y2, col=2)
which gives black circles for y1 and a red one for y2. That works
reasonably well for col from 1 to 6, but col=7 is a yellow that many
viewers find very difficult to see on the white background that are preferred
in technical publications. Also, some of the colours are more glaring than
others, which leads to an ugly unevenness in the results, and possibly to
confusion, since some viewers might think that the glaring colours are used to
indicate importance (akin to glaring highlighter pen).
The solution provided in R 4.x
The upcoming R-4 (4.0 is available now as a pre-release, but it is still in
active development and therefore not recommended for routine work) will
solve this. The default colours will be more visible, more balanced, and also
better for those with certain vision challenges. Several palettes are
provided, including the one used prior to R 4.x (use palette("R3") to get the
old scheme).
A practical example
Here’s a simple example that shows the new scheme:
1
2
3
4
5
6
7
8
9
10
11
12
13
14
15
x <- 1:8
# The next call to palette() is not actually needed unless there was a prior
# cal specifying R3.  Still, retaining this call is useful because it
# means that the user does not have to check previous code (including in
# functions they may not have written, to be sure that we are not using R3.
palette("R4")
plot(x, rep(0.9, 8), ylab="", ylim=c(0.5,1.5), pch=20, cex=4, col=1:8)
points(x, rep(0.85, 8), cex=2, col=1:8)
for (i in 1:8) abline(h=0.85-i/40, col=i)

# Now, show th old colours. Note how bad the yellow is.
palette("R3")
points(x, rep(1.1, 8), pch=20, cex=4, col=1:8)
points(x, rep(1.15, 8), cex=2, col=1:8)
for (i in 1:8) abline(h=1.15+i/40, col=i)
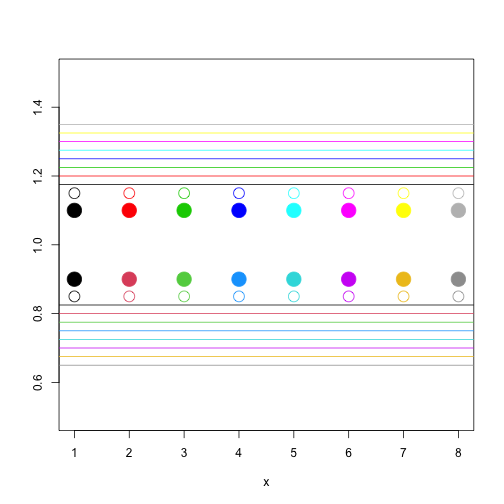
Many viewers may find the new palette (lower dots) preferable to the old palette (upper dots). For me, the biggest improvement is with the yellow dot, which is clearly visible in R-4.
It is worth noting that the new colours are similar enough to the old ones that text referring to the diagram may still be valid (“yellow” is still “yellow”).
Reference [1] explains more about the new palettes in R-4, and it is worth reading, to learn about other new palettes that are coming, and about efforts to make the new results more visible for those with difficulties with colour vision.
References and resources
-
RStudio blog item on the new colour scheme: https://developer.r-project.org/Blog/public/2019/11/21/a-new-palette-for-r/index.html
-
Jekyll source code for this blog entry: 2019-12-15-new-R-palette.Rmd