The filtfilt function in R is supposedly based on the Matlab one, but it does quite badly on endpoints. My goal here is to explore alternatives, with a focus on the Octave method.
NOTE: I may also try scipy for hints.)
The best method of dealing with endpoints is still an open question. Matlab does one thing, Octave does another. Both seem to work reasonably well, and the Octave license is more appropriate to the present task, so I am focussing on that.
This is a page in progress. I am trying to make some of my R code work exactly as Octave does, since then I’ll know that I’ve successfully mimicked their method. This is proving to be difficult! I started this page weeks ago and have returned to it several times. If/when I figure it out, I will update the date of the blog posting and remove the “draft” designation.
If any readers have ideas, please let me know!
Octave implementation
Full code (with initial comments removed for brevity)
function y = filtfilt(b, a, x)

  if (nargin != 3)
    print_usage;
  endif
  rotate = (size(x,1)==1);
  if rotate,                    # a row vector
    x = x(:);                   # make it a column vector
  endif

  lx = size(x,1);
  a = a(:).';
  b = b(:).';
  lb = length(b);
  la = length(a);
  n = max(lb, la);
  lrefl = 3 * (n - 1);
  if la < n, a(n) = 0; endif
  if lb < n, b(n) = 0; endif

  ## Compute a the initial state taking inspiration from
  ## Likhterov & Kopeika, 2003. "Hardware-efficient technique for
  ##     minimizing startup transients in Direct Form II digital filters"
  kdc = sum(b) / sum(a);
  if (abs(kdc) < inf) # neither NaN nor +/- Inf
    si = fliplr(cumsum(fliplr(b - kdc * a)));
  else
    si = zeros(size(a)); # fall back to zero initialization
  endif
  si(1) = [];

  for (c = 1:size(x,2)) # filter all columns, one by one
    v = [2*x(1,c)-x((lrefl+1):-1:2,c); x(:,c);
         2*x(end,c)-x((end-1):-1:end-lrefl,c)]; # a column vector

    ## Do forward and reverse filtering
    v = filter(b,a,v,si*v(1));                   # forward filter
    v = flipud(filter(b,a,flipud(v),si*v(end))); # reverse filter
    y(:,c) = v((lrefl+1):(lx+lrefl));
  endfor

  if (rotate)                   # x was a row vector
    y = rot90(y);               # rotate it back
  endif

endfunction
Test
pkg load signal
[b, a]=butter(3, 0.1);                  # 10 Hz low-pass filter
t = 0:0.01:1.0;                         # 1 second sample
load x.dat # created by the R code, to ensure both have same data
y = filtfilt(b,a,x); z = filter(b,a,x); # apply filter
plot(t,x,';data;',t,y,';filtfilt;',t,z,';filter;')
R implementation
1
2
3
4
5
6
7
8
9
10
11
12
13
14
15
16
17
18
19
20
21
22
23
24
25
26
27
28
29
30
31
32
33
34
35
ab <- signal::butter(3, 0.1)
t <- seq(0, 1, 0.01)
x <- scan("x.dat")
## below could be extracted to a function when working
a <- ab$a
b <- ab$b
na <- length(a)
nb <- length(b)
kdc <- sum(b) / sum(a)
if (!is.nan(kdc)) {
  si <- rev(cumsum(rev(b - kdc * a)))
} else {
  si <- rep(0, length(a))
}
lx <- length(x)
si <- si[-1]
nx <- length(x)
n <- max(na, nb)
lrefl <- 3 * (n - 1)
if (na < n)
    a <- c(a, rep(0, length.out=n-na))
if (nb < n)
    b <- c(b, rep(0, length.out=n-nb))
v <- c(2*x[1]-x[seq.int(lrefl+1,2,-1)],
           x,
           2*x[nx]-x[seq.int(nx-1,nx-lrefl,-1)])
v_before_first_filter <- v[1:4]

#v <- signal::filter(b, a, v, init.x=si*v[1])    # forward filter (WRONG OUTPUT)
si_v1 <- si * v[1]
#v <- signal::filter(b, a, v, init=si*v[1])    # forward filter (WRONG OUTPUT)
#v <- signal::filter(b, a, v, init.x=si*v[1])    # forward filter (WRONG OUTPUT)
#v <- signal::filter(b, a, v, init.y=si*v[1])    # forward filter (WRONG OUTPUT)
#v <- signal::filter(b, a, v, init.x=si*v[1])    # forward filter (WRONG OUTPUT)
v <- stats::filter(b, a, v, init=si*v[1])    # forward filter (WRONG OUTPUT)
## Error: 'arg' must be NULL or a character vector1
2
3
4
5
6
7
8
v_after_first_filter <- v[1:4]
si_vend <- si*v[length(v)]
v <- rev(signal::filter(b,a,rev(v),init.x=si*v[length(v)])) # reverse filter
v_after_first_filter <- v[1:4]
y <- v[seq.int(lrefl+1, lx+lrefl)]
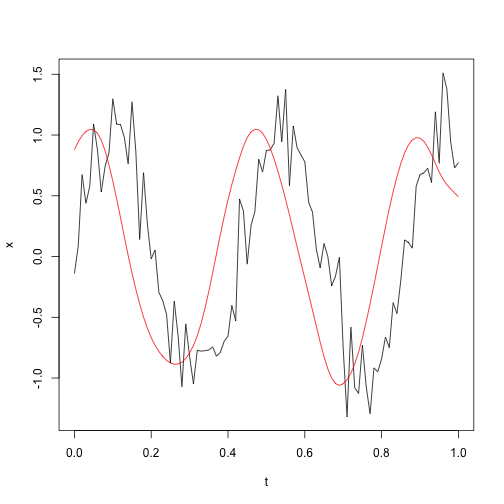
plot(t, x, type='l')
lines(t, y, col='red')
Comparison between R and octave output
The test codes a.m and a.R are the basis for the above.
Some R values (and comparisons with octave output) are given below.
si: 0.9971, -1.3857, 0.535 (expect 0.99710 -1.38569 0.53497)lrefl: 9 (expect 9)si_v1: -1.1293, 1.5694, -0.6059(expect -1.12926 1.56935 -0.60588)si_vend: 0.8557, -1.1891, 0.4591(expect 0.65164 -0.90559 0.34962)v_before_first_filter: -1.1325, -1.0238, -0.8117, -1.1579 (expect -1.132546 -1.023766 -0.811650 -1.157909 -1.370316 -0.858954 -0.717951 …)v_after_first_filter: -0.6099, -0.4232, -0.219, -0.0097 (expect -1.157285 -1.123425 -1.072315 -1.001433 -0.909024 -0.794494 -0.658707 …)
Since v was ok before the filter, and wrong after, the problem seems to be in filter().
Finding the problem may be arduous, since (a) the R function stats::filter() is not well documented, regarding init, init.x and init.y, and (b) the Octave filter() spans 700 lines of C, so it is hard to reverse engineer to figure out what it’s doing.
filter.cc
I’ll start by assuming that this is trying to mimic the Matlab function of the same name, although the 4th arg is called si in Octave and zi in Matlab, so some caution is warranted.
The docs on the matlab version are here
-
it takes 4 args, the last of which (
si) is perhaps worth investigating, since it’s different from the initialization in the R filter (which has 3 items). -
sigets renamed aspsiin line 166
Resources
- Matlab test code a.m
- R signal::filter.R
- R test code a.R
- test data used by above two codes x.dat
- matlab filtfilt.m
- the octave script filtfilt.m can be acquired by typing
pkg install -forge signalin an Octave window, and extracting file named~/octave/signal-1.3.0/filtfilt.m - the octave C filtering code filter.cc is the file
libinterp/corefcn/filter.ccin the Octave source.