Analysis
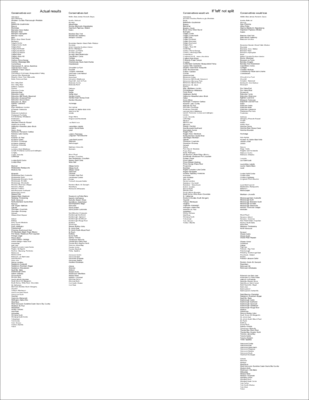
District-by-district data reveal that if the Bloc Quebecois, Green, Liberal, and NDP parties were to have been united, the Conservative party would have lost the 41st Canadian election by a dramatic measure, instead of winning a majority.
The graph given below shows the results by naming the ridings. Clicking on the graph will let you see results riding by riding, but the overview is also useful. The first two columns show the actual election results, with those that went Conservative (in the first-past-the-post system) to the left, and those that went to another party to the right. A clear majority is seen at a glance. The two columns on the right are analogous, but under the scenario that the non-Conservative parties were to form a new party.
(Note that a few fringe parties were removed from the analysis.)
R code that made the graph
1
2
3
4
5
6
7
8
9
10
11
12
13
14
15
16
17
18
19
20
21
22
23
24
25
26
27
28
29
30
31
32
33
34
35
36
37
38
39
40
41
42
43
44
45
46
47
48
49
50
51
52
53
54
55
56
57
58
59
60
61
62
63
64
65
66
67
68
69
70
71
72
73
74
75
76
77
78
79
80
81
82
83
84
85
86
87
88
89
90
91
92
93
## DATA SOURCE: the file named e41m.txt was downloaded
## 2011-05-04 from http://enr.elections.ca/DownloadResults.aspx
## (after clicking the 'latest results' link near the bottom of
## the left-hand column).  Some trailing blank lines were removed.
e <- read.csv("e41m.txt", sep="\t", encoding="latin1")
## shorten column names
colNames <- c("distNum", "distName", "distNameFR","type","typeFR","lname","mname","fname",
              "affil", "affilFR","votes","percentVotes","rejected","total")
names(e) <- colNames
## remove columns that we won't use
e <- e[, names(e) != "distNameFR"]
e <- e[, names(e) != "typeFR"]
e <- e[, names(e) != "affilFR"]
e <- e[, names(e) != "mname"]

## shorten relevant party names
levels(e$affil)[levels(e$affil) == "Bloc Québécois"] <- "Bloc"
levels(e$affil)[levels(e$affil) == "Conservative"] <- "Con"
levels(e$affil)[levels(e$affil) == "Green Party"] <- "Green"
levels(e$affil)[levels(e$affil) == "Liberal"] <- "Lib"
levels(e$affil)[levels(e$affil) == "NDP-New Democratic Party"] <- "NDP"

## categorize by district
f <- factor(e$distNum)
ee <- split(e, f)
district <- NULL
bloc <- NULL
green <- NULL
con <- NULL
lib <- NULL
ndp <- NULL
conWon <- NULL
conWouldWin <- NULL
nd <- length(ee)
for (i in 1:nd) {
    d <- ee[i][[1]]
    ## restrict to validated data, if we have them
    if (any(d$type == "validated"))
        d <- d[d$type == "validated",]
    affil <- as.character(d$affil)
    percentVotes <- d$percentVotes
    district <- c(district, as.character(d$distName[1]))
    thisbloc <- if (any(affil=="Bloc")) percentVotes[affil=="Bloc"] else 0
    thiscon <- if (any(affil=="Con")) percentVotes[affil=="Con"] else 0
    thisgreen <- if (any(affil=="Green")) percentVotes[affil=="Green"] else 0
    thislib <- if (any(affil=="Lib")) percentVotes[affil=="Lib"] else 0
    thisndp <- if (any(affil=="NDP")) percentVotes[affil=="NDP"] else 0
    con <- c(con, thiscon)
    ndp <- c(ndp, thisndp)
    lib <- c(lib, thislib)
    bloc <- c(bloc, thisbloc)
    green <- c(green, thisgreen)
    conWon <- c(conWon, thiscon > max(thisndp, thislib, thisbloc, thisgreen))
    conWouldWin <- c(conWouldWin, thiscon > sum(thisndp, thislib, thisbloc, thisgreen))
}
results <- data.frame(district, con, ndp, lib, bloc, green, conWon, conWouldWin)
results <- results[order(results$district), ]

png("split.png", width=8.5, height=11, unit="in", res=200, pointsize=7)
par(mfrow=c(1,1), mar=c(0,0,0,0),mgp=c(0,0,0))
plot(c(0,1), c(0,1), xlab="", ylab="", type='n')
jconwon <- 1
jconwonnot <- 1
jconwouldwin <- 1
jconwouldwinnot <- 1
yy <- 0.0051
cex <- 0.45
text(x=0.1, y=1.01, "Actual results", adj=0)
text(x=0.7, y=1.01, "If 'left' not split", adj=0)
text(x=0, y=1.005, "Conservatives won", adj=0, cex=2/3)
text(x=0.2, y=1.005, "Conservatives lost", adj=0, cex=2/3)
text(x=0.6, y=1.005, "Conservatives would win", adj=0, cex=2/3)
text(x=0.8, y=1.005, "Conservatives would lose", adj=0, cex=2/3)
for (i in 1:nd) {
    district <- iconv(as.character(results$district[i]), to="UTF8")
    if (results$conWon[i]) {
        text(x=0, y=1-yy*jconwon, district, cex=cex, adj=0)
        jconwon <- jconwon + 1
    }
    if (!results$conWon[i]) {
        text(x=0.2, y=1-yy*jconwonnot, district, cex=cex, adj=0)
        jconwonnot <- jconwonnot + 1
    }
    if (results$conWouldWin[i]) {
        text(x=0.6, y=1-yy*jconwouldwin, district, cex=cex, adj=0)
        jconwouldwin <- jconwouldwin + 1
    }
    if (!results$conWouldWin[i]) {
        text(x=0.8, y=1-yy*jconwouldwinnot, district, cex=cex, adj=0)
        jconwouldwinnot <- jconwouldwinnot + 1
    }
}
dev.off()
