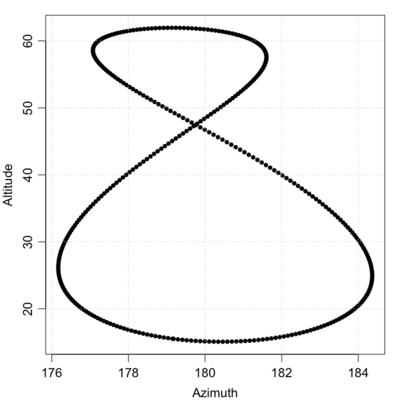
Analemma graphs
Dec 27, 2013
A method is illustrated for plotting analemma diagrams in R.
Continuing on the theme of solar angles, the code given below produces an analemma diagram similar to that of Lynch (2012, figure 2).
1
2
3
4
5
6
7
8
9
10
library(oce)
loc <- list(lon=-0.0015, lat=51.4778)  # Greenwich Observatory
t <- seq.POSIXt(as.POSIXct("2014-01-01 12:00:00", tz="UTC"),
                as.POSIXct("2015-01-01 12:00:00", tz="UTC"),
                by="1 d")
sa <- sunAngle(t, lon=loc$lon, lat=loc$lat)
par(mar=c(3, 3, 1, 1), mgp=c(2, 0.7, 0)) # tighten margins
plot(sa$azimuth, sa$altitude, type='p', pch=20,
     xlab="Azimuth", ylab="Altitude")
grid()
References
Peter Lynch, 2012. The equation of time and the analemma. Irish Math. Soc. Bulletin, 69:47-56. PDF
