Drawing Spiciness Contours on a TS Diagram
I often want to draw spiciness contours on TS diagrams. The docs explain how,
but I am thinking of adding this as a feature to plotTS(), to save folks a
step.
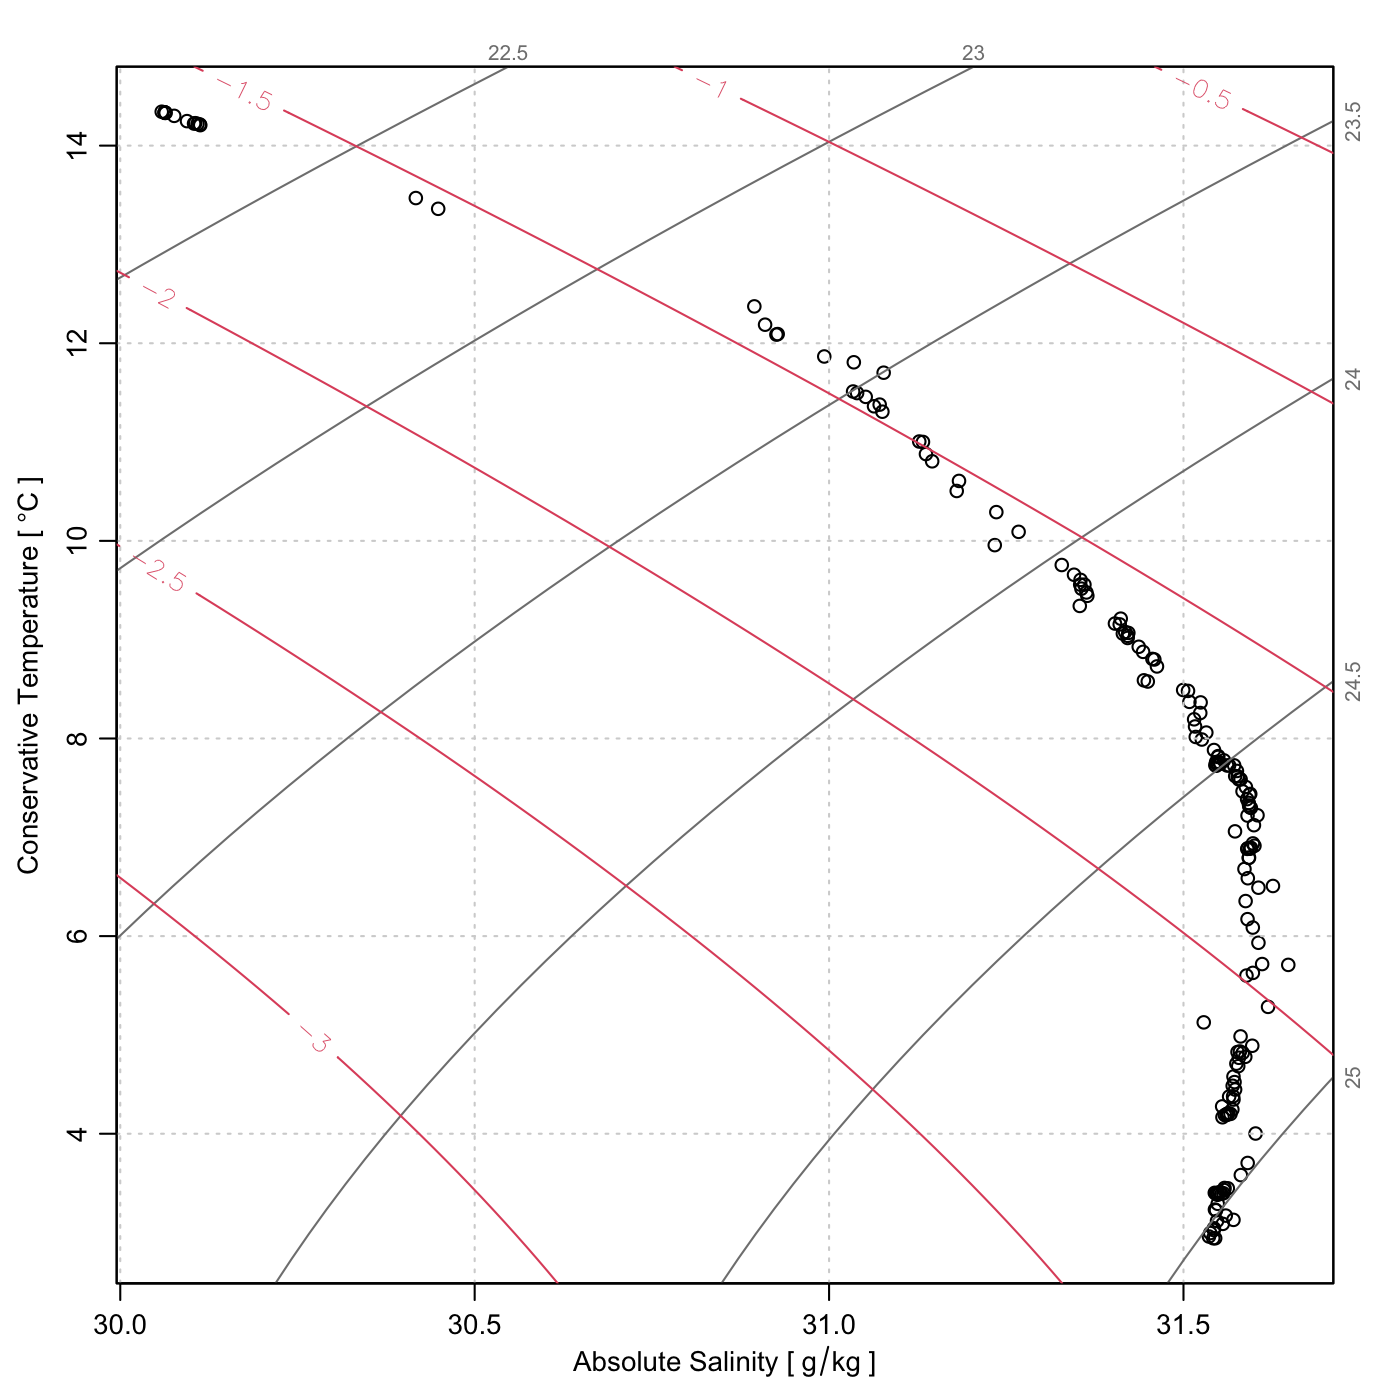
The idea is exemplified above, with code below. I’m not saying that this is
difficult, and that’s why this is not in plotTS(). But it might be useful
… thinking out loud here.
library(oce)
data(ctd)
plotTS(ctd)

usr <- par("usr")
n <- 100
SAgrid <- seq(usr[1], usr[2], length.out = n)
CTgrid <- seq(usr[3], usr[4], length.out = n)
g <- expand.grid(SA = SAgrid, CT = CTgrid)
spiciness <- matrix(gsw::gsw_spiciness0(g$SA, g$CT), nrow = n)
contour(SAgrid, CTgrid, spiciness,
    col = 2, add = TRUE, labelcontours = TRUE,
    labcex = 1, nlevel = 8
)