Find Environment Canada Met station ID for Halifax
The dod1 package function dod.met() assumes a default ID as 6358, for
Halifax International Airport. I think this worked in September 2023 (or
I’m guessing it did then, because I sometimes use such data in classes)
but now that does not produce any data. So I tried Gavin Simpson’s
wonderful canadaHCD package2 to find stations with data. As shown
below, 6358 now has no data. I think a good default might be the
Dockyard, 43405.
library("canadaHCD")
s <- find_station("Halifax")
d <- lapply(s$StationID, \(id) {
    h <- hcd_hourly(id, 2024, 3)
    sum(is.finite(h$Pressure))
})
A summary is given by
data.frame(name = s$Name, id = s$StationID, npressure = as.numeric(d))

##                         name    id npressure
## 1    BABINE LAKE HALIFAX BAY   455         0
## 2                    HALIFAX  6355         0
## 3                    HALIFAX  6356         0
## 4            HALIFAX CITADEL  6357         0
## 5            HALIFAX COMMONS 49128         0
## 6           HALIFAX DOCKYARD 43405       359
## 7  HALIFAX STANFIELD INT'L A 53938       360
## 8  HALIFAX STANFIELD INT'L A  6358         0
## 9  HALIFAX STANFIELD INT'L A 50620       360
## 10          HALIFAX KOOTENAY 43124       359
## 11      HALIFAX WINDSOR PARK 43403       359

ID <- 43405 # Halifax Dockyard has data, but 6355 and 6456 do not
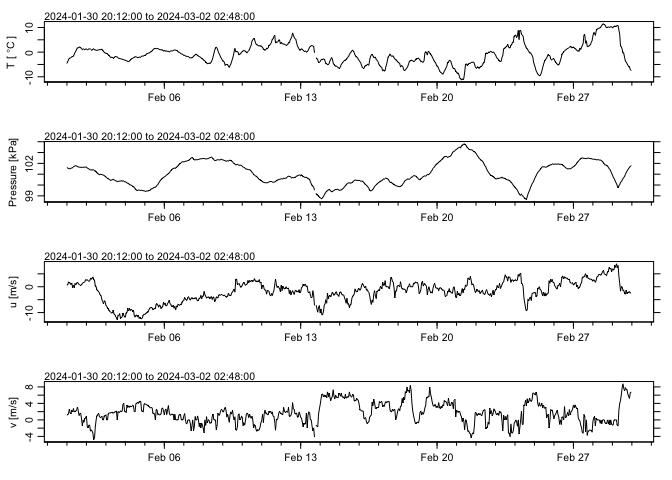
Now, we can use dod::dod.met() to get the data, and the oce package to
summarize and then plot some information contained in the file.
library(dod)
library(oce)

## Loading required package: gsw

m <- dod.met(ID)
d <- read.met(m)
summary(d)

## Met Summary
## -----------
##
## * Source                     "./met_43405_hourly_2024_02_01.xml"
## * Name                       HALIFAX DOCKYARD
## * Province                   NOVA SCOTIA
## * Station Operator           Department of National Defence
## * Latitude                   44.66
## * Longitude                  -63.58
## * Elevation                  3.8
## * Climate Identifer          8202240
## * World Met Office Identifer 71328
## * Transport Canada Identifer AHD
## * Note                       If Local Standard Time (LST) was selected, add 1 hour to adjust for Daylight Saving Time where and when it is observed.
## * Time: 2024-02-01 to 2024-02-29 23:00:00 (696 samples, mean increment 1 hour)
## * Data Overview
##
##                                 Min.     Mean   Max. Dim. NAs OriginalName
##     dewPoint [°C, ITS-90]      -17.4  -4.0724   10.6  696   1       dptemp
##     direction [°]                  0   254.76    360  696   3            -
##     humidex [°C, ITS-90]          NA       NA     NA  696 696      humidex
##     humidity [%]                  37   80.311    100  696   1       relhum
##     pressure [kPa]             98.64   101.06 103.81  696   1     stnpress
##     speed [m/s]                    0   4.7038 13.056  696   1            -
##     temperature [°C, ITS-90]   -11.2 -0.87022   11.5  696   1         temp
##     u [m/s]                  -12.778  -1.8971 8.8889  696   1            -
##     v [m/s]                  -4.8113   1.6625 8.7538  696   1            -
##     visibility                    NA       NA     NA  696 696   visibility
##     weather                       NA       NA     NA  696   1      weather
##     windChill [°C, ITS-90]       -17  -8.9758     -1  696 282    windchill
##
## * Processing Log
##
##     - 2024-03-16 16:42:39.290 UTC: `create 'met' object`
##     - 2024-03-16 16:42:39.326 UTC: `read.met.xml2(file="./met_43405_hourly_2024_02_01.xml", skip=NULL, tz="UTC")`

plot(d)
Footnotes