Downloading data from NOAA server
Introduction
Several web sites provide oceanographic data. Each has pluses and minuses, so oceanographers can have difficulty deciding which is best-suited to a given purpose. The sites differ not just in their data offerings but also in their user interfaces. Experience gained with one site does not necessarily make it easier to use a second site.
It does not help that new sites keep cropping up, each approaching the problem in a different way. The “Standards” XKCD cartoon (Reference 1) comes to mind.
In this post (and in a video pointed to in Reference 2), I will explain how to use one particular site from NOAA (Reference 3). So far, this site has held the data I’ve been looking for, and its user interface has not frustrated me. That puts it at the top of my list. This does not mean that it will be best for you, but it might mean that what I have to say here might save you some time, in case you want to try the site.
For me, the choice of data website boils down to five criteria. I prefer sites that
- offer a wide range of data, new as well as old,
- have an easy-to-use graphical interface,
- offer a way to skip that graphical interface by means of URL construction,
- offer data free of charge, and
- remain relatively stable over time.
The NOAA site (Reference 3) meets several of these criteria.
My goal here is to make it easier for you to try this site, in case you think it might meet your own needs. I will do this step-by-step, with illustrations.
My task in this example is to download CTD data from R.V. Endeavor in 1988.
1. Set the scope of your search
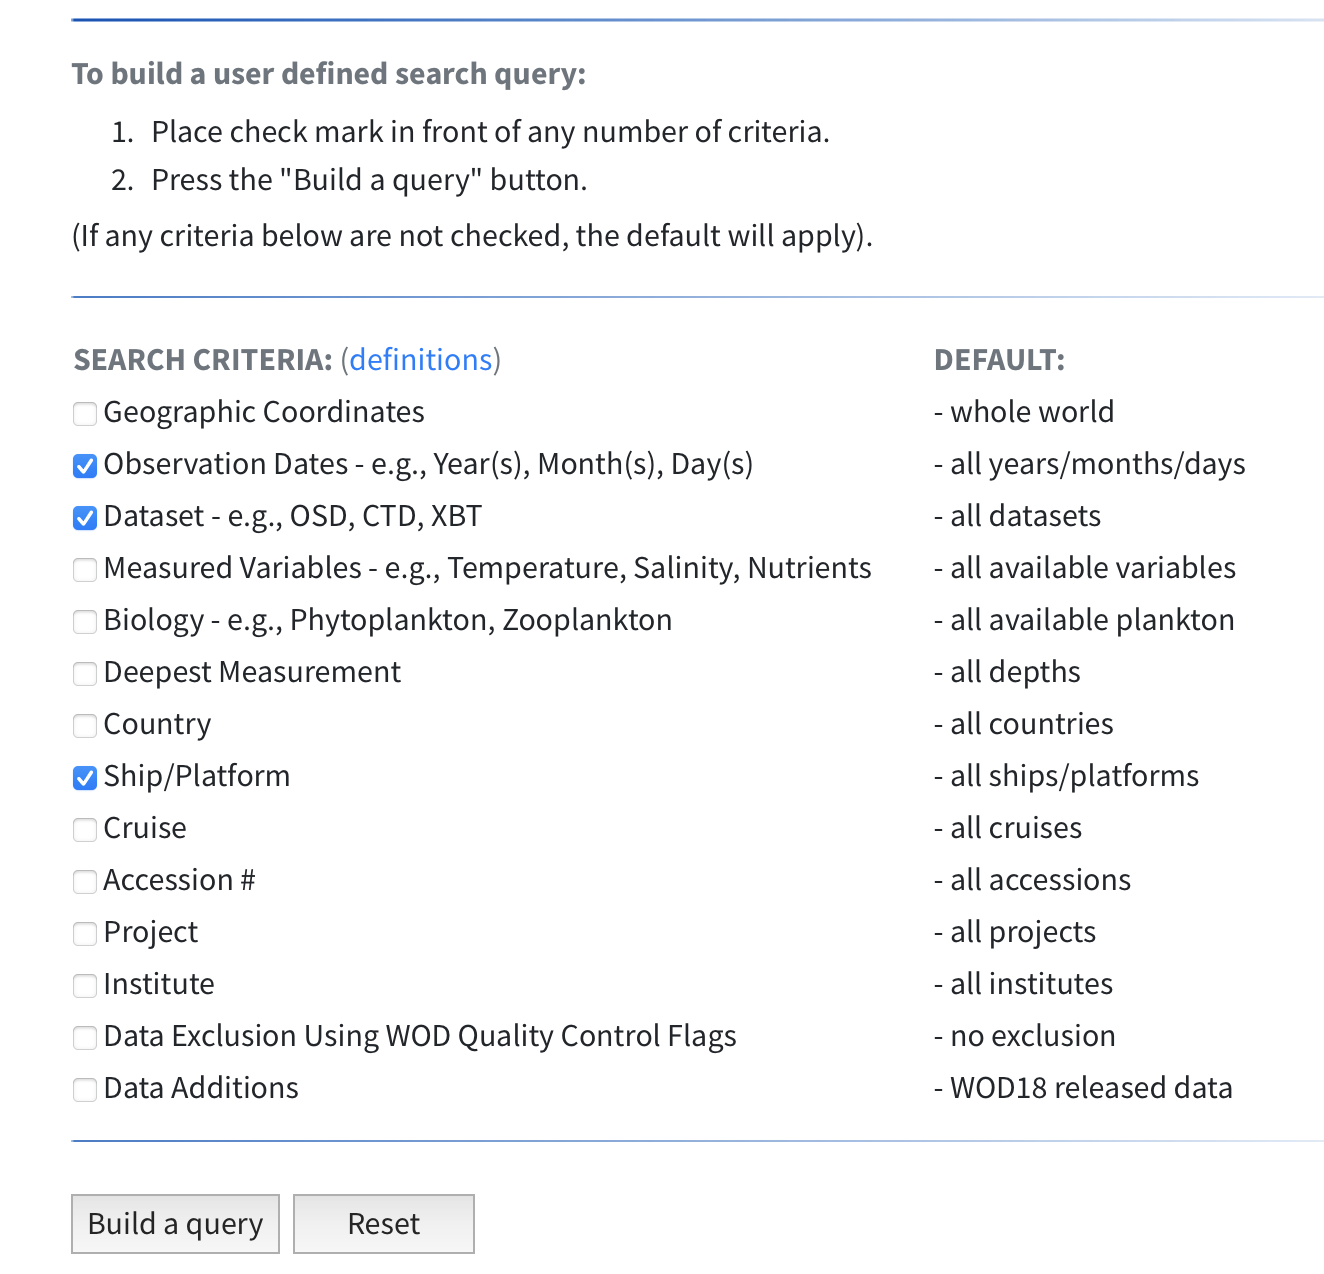
When you visit Reference 3 and scroll to the bottom of the page, you will see the view shown below. What to do next is quite straightforward, so this site meets Criterion 2. And, from the checkbox list, we have evidence that Criterion 1 may also be met.
The snapshot shows that it is easy to construct a search based on the criteria of the present task, among several others.
2. Build a search query
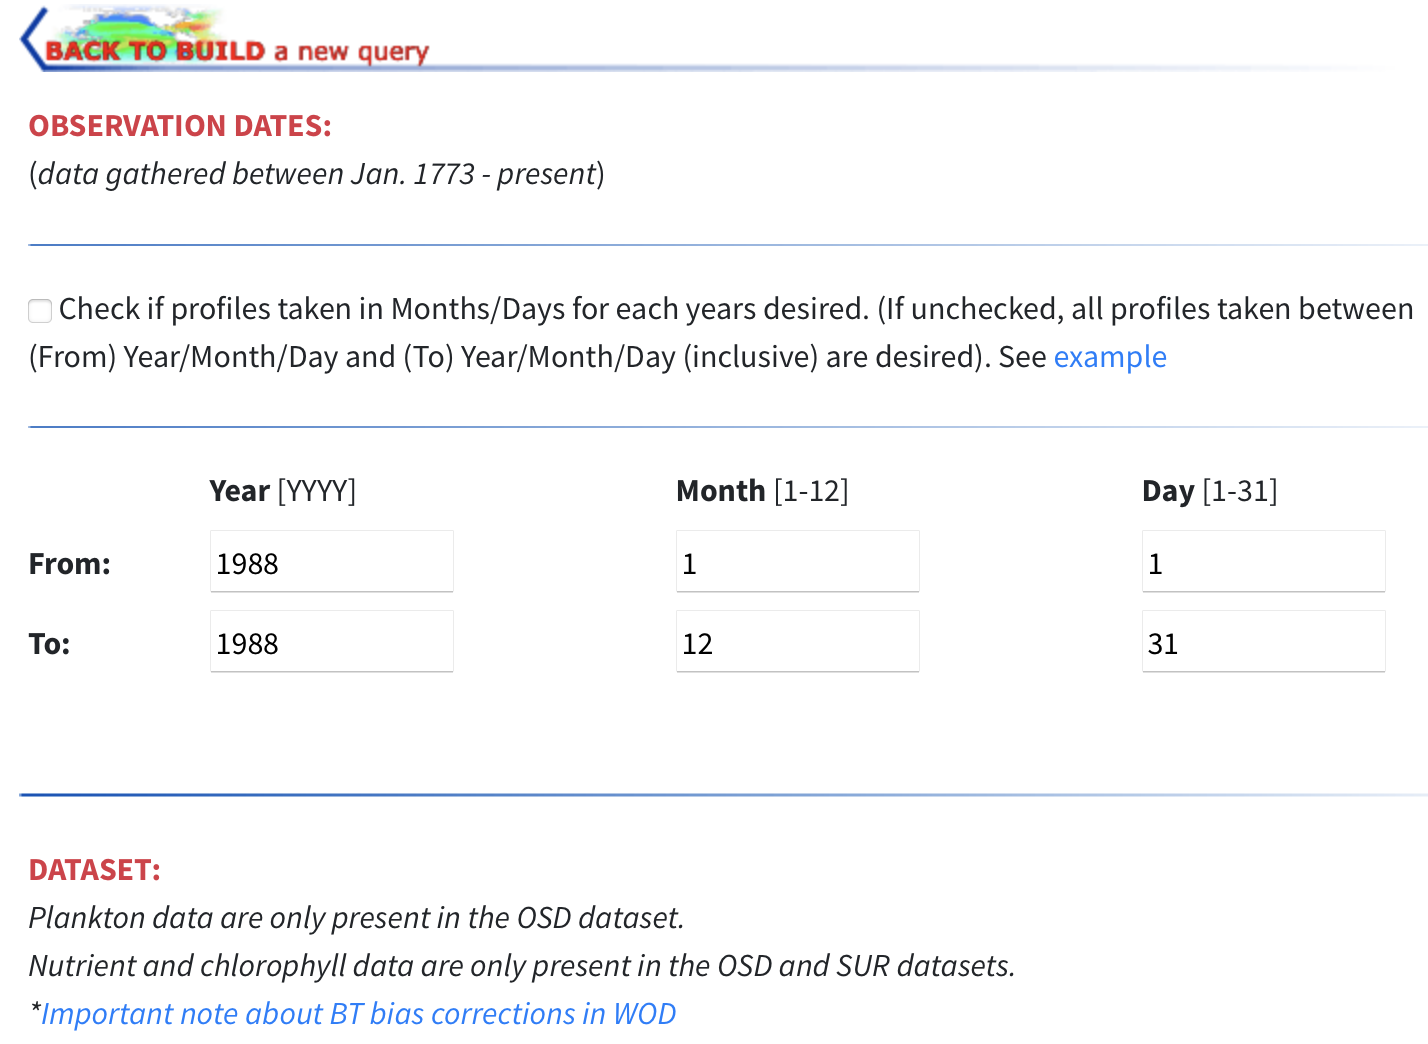
At the top of the query page, shown below, I selected a range of dates.
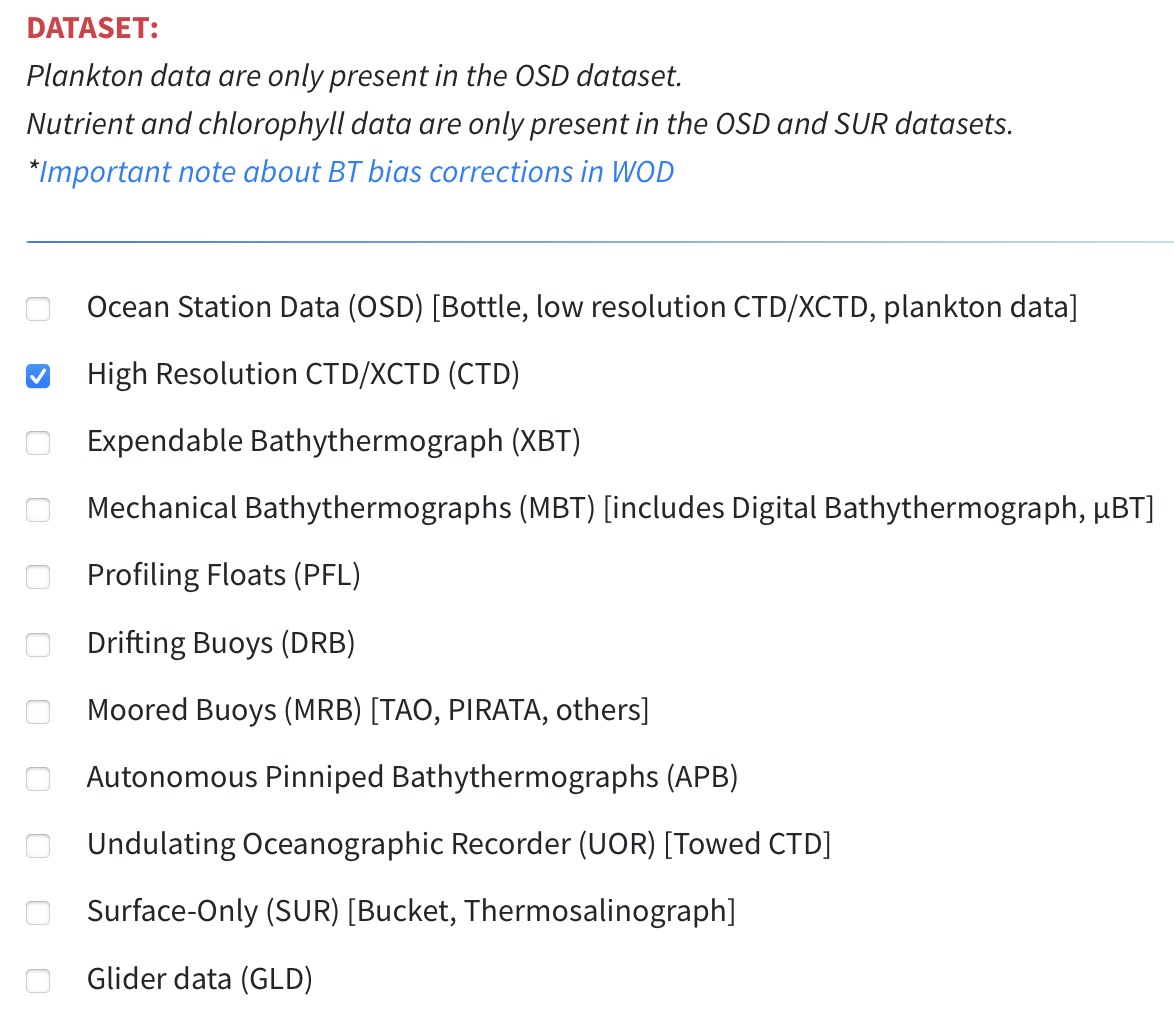
Scrolling down on the page, I selected just the CTD option, unchecking the others.
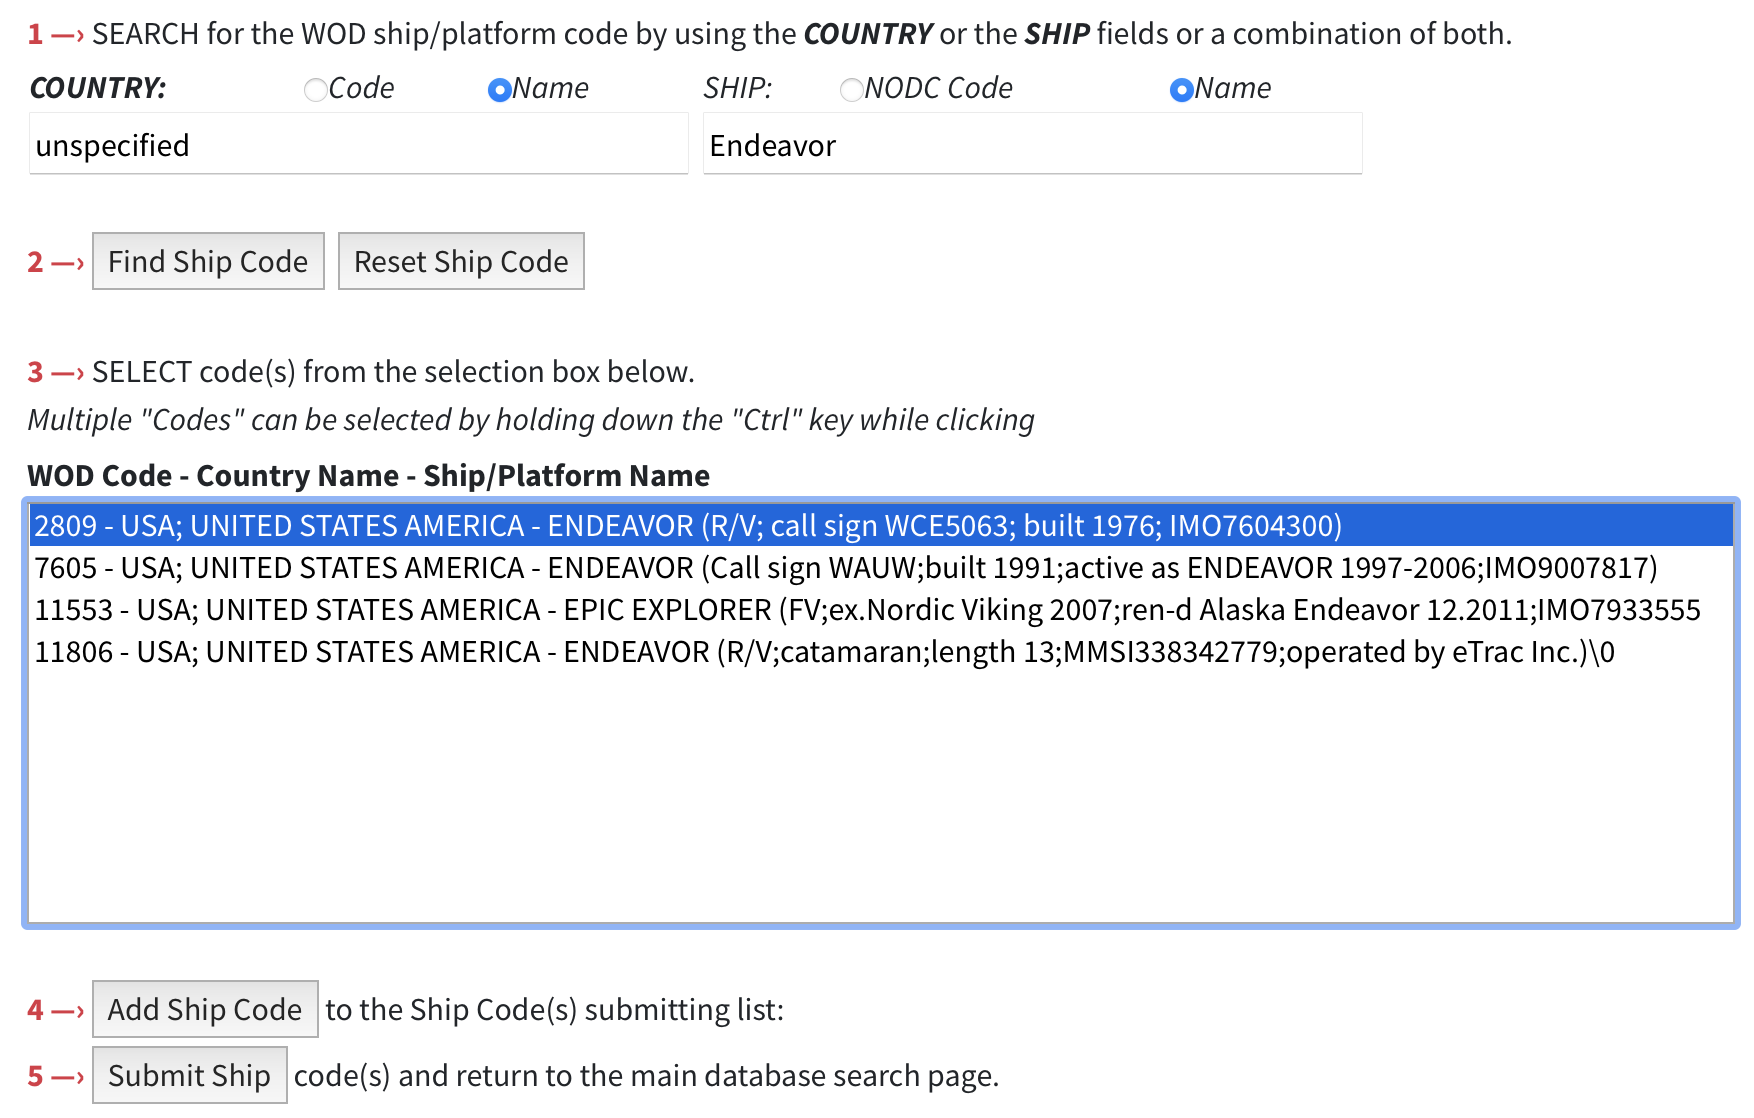
Further down, there is a spot to specify the ship.
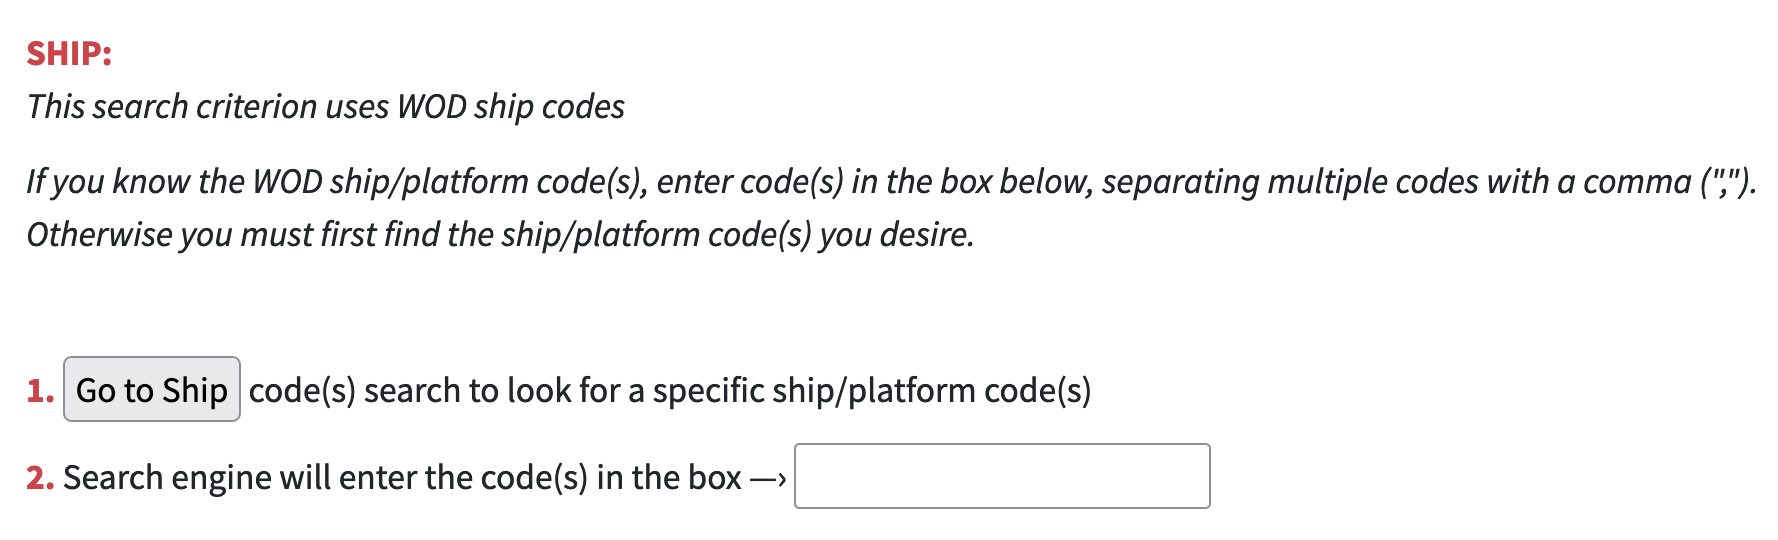
If you know the ship number, you can enter it into the box numbered 2. However, even a given ship can have different ship numbers over its history, so it is best to instead click the “Go to ship” box. When you do that, you will see a page that lets you search for a ship. I want the Endeavor, as it existed during 1988, so I selected the choice you can see here. Then I clicked the “Submit ship” button.
At this point, the website returns to the previous page, with the ship code number filled in.
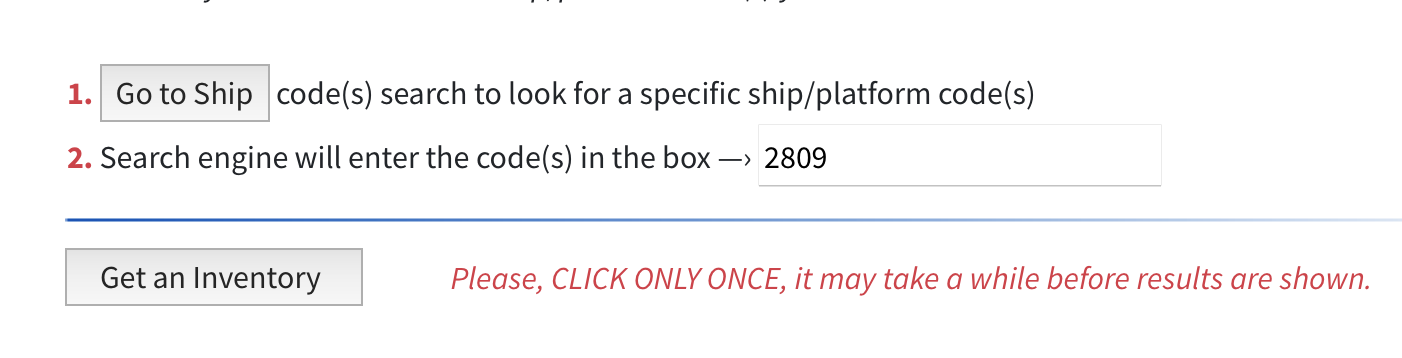
We are getting near the end! The next step is to click the button labelled “Get an inventory”. After a minute or so, we get to a new page.
3. Verify that the dataset is what you want
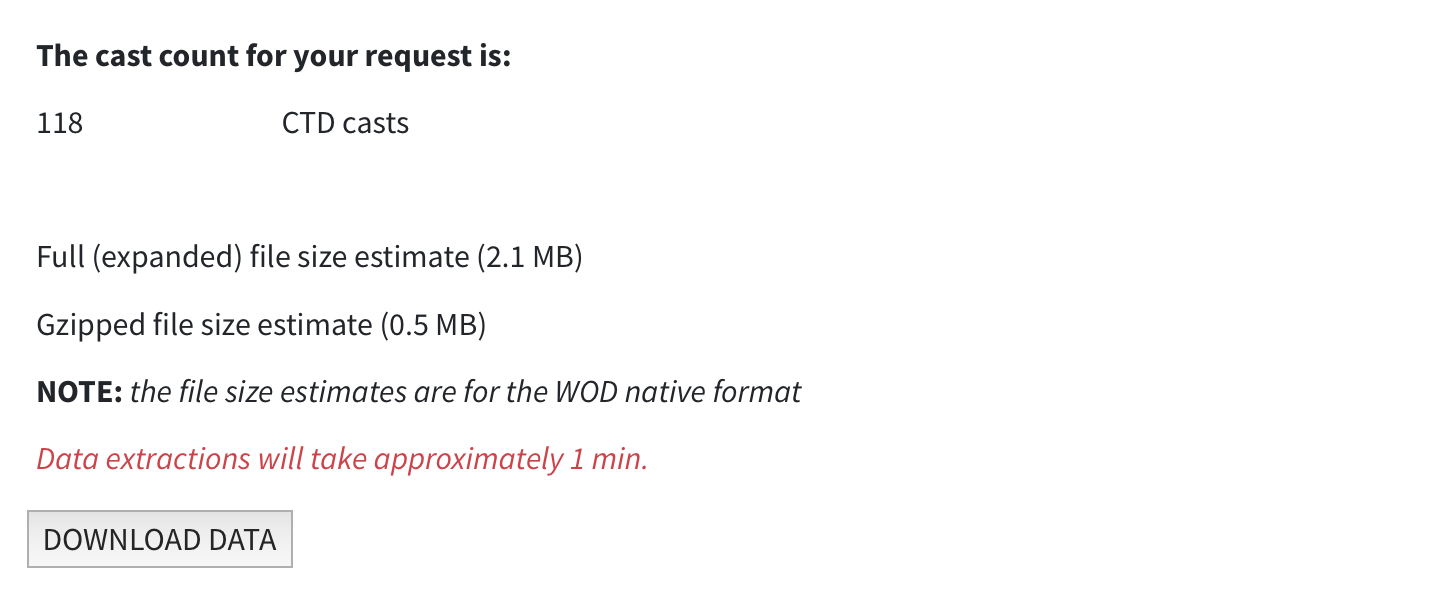
On this new page, it will either indicates that the site has the data you asked for, or not. In my case, it did find data.
The page has buttons named “VIEW DATA DISTRIBUTION PLOT” and “CRUISE LIST”. I didn’t click either, because I want to look at the data using my own tools. At the bottom of the page is a button labelled “DOWNLOAD DATA”.
4. Specify a download format
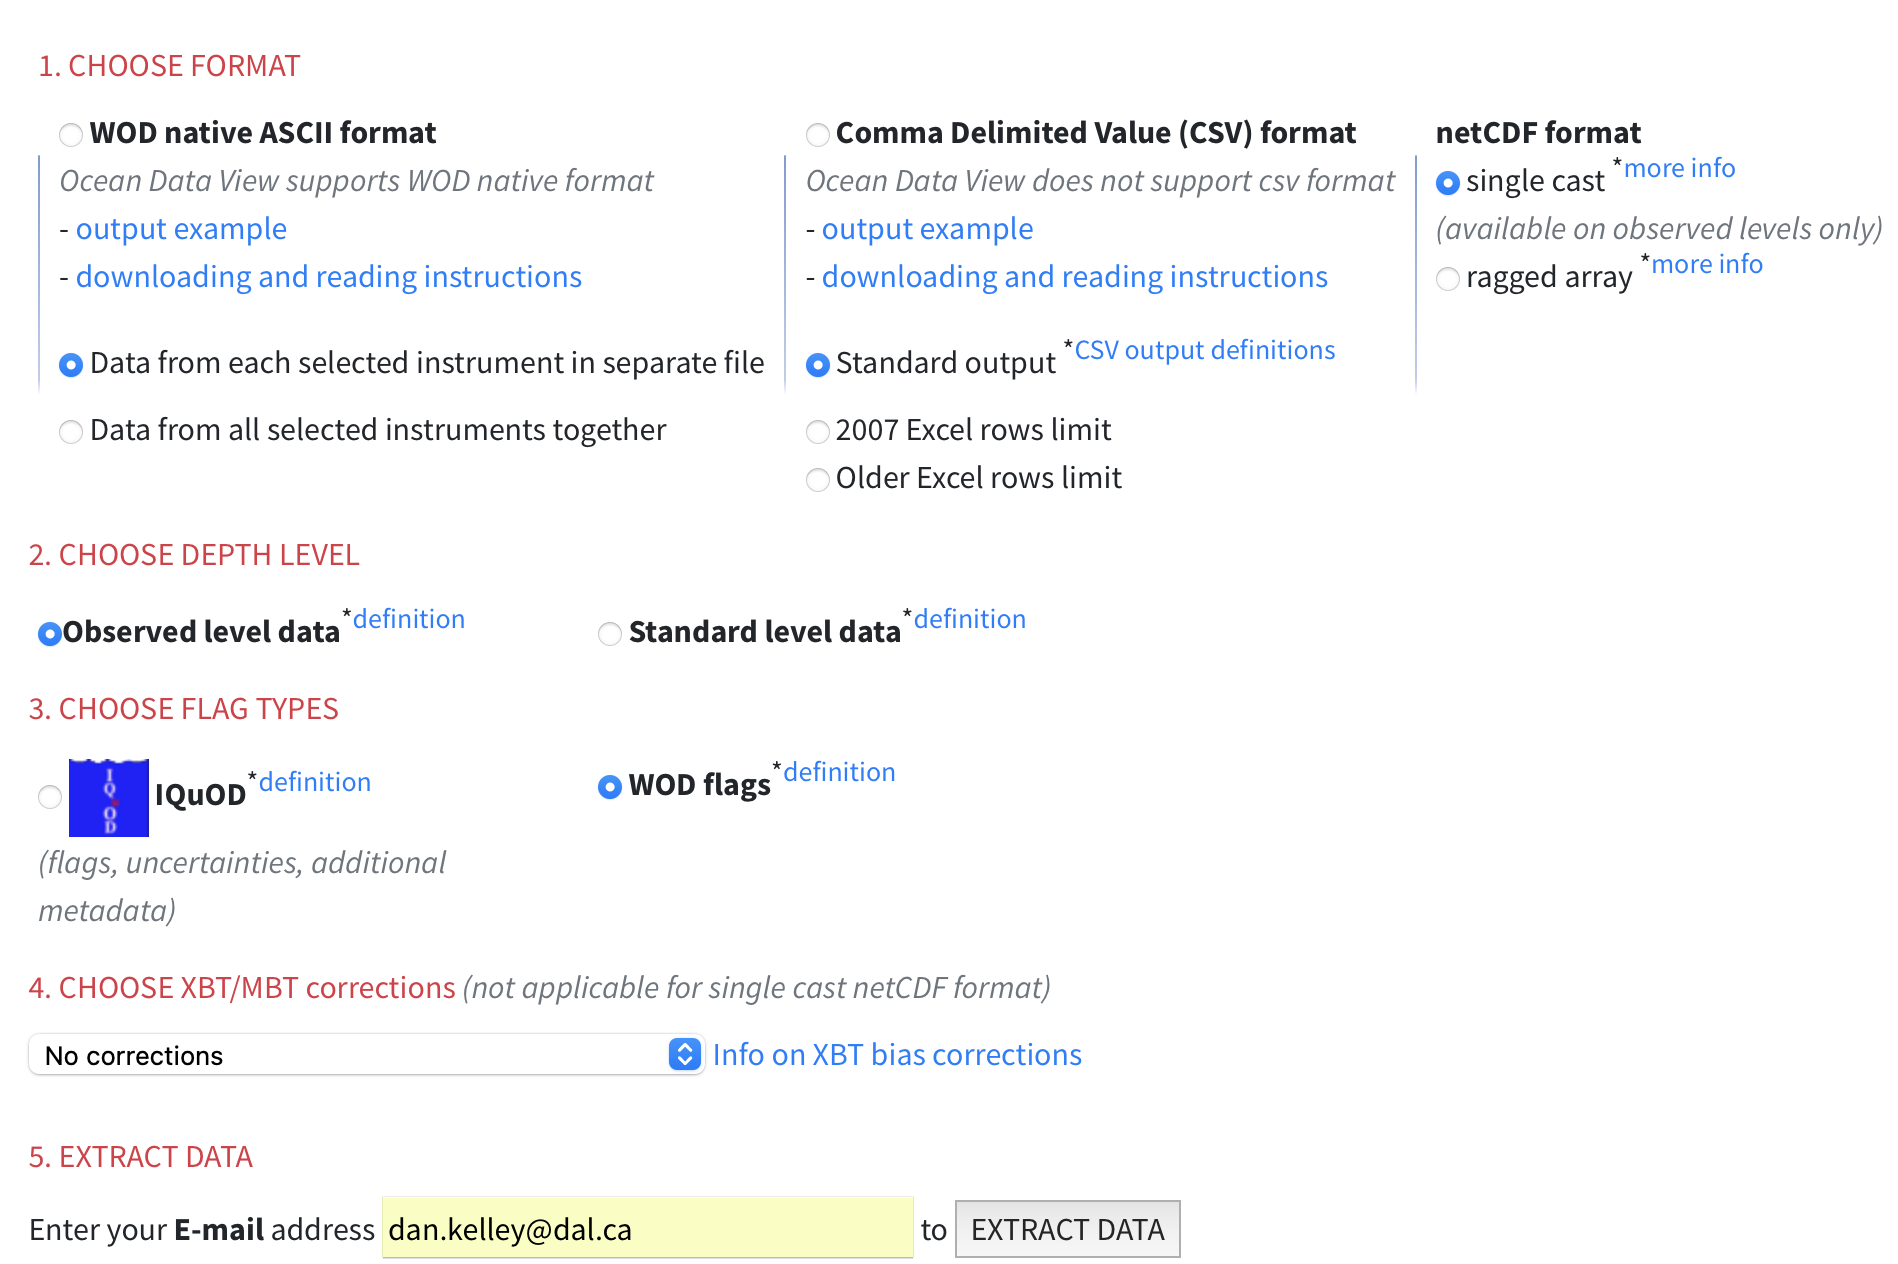
At this stage, you get to decide on a data format, and some details of the data themselves. The interface looks like the image below.
This is the final step of the process.
The item marked “1 CHOOSE FORMAT” offers three choices. I’ve tried all three of them. I found that “WOD native ASCII format” yields a file that consists of long blocks of numbers and letters. Being unfamiliar with this format, I tried building some of the data-reading tools that are given by NOAA. This included code in C and in Fortran, languages with which I have several decades of experience. None of the programs I tried would even compile. And the compendium seemed not to be official, in any case, so I was uncertain as to whether I would even believe the results. I cannot recommend this option.
I also tried the “Comma Delimited Value (CSV) format” option, and that might be the easiest to handle. However, I never got an email telling me that the files had been prepared. I cannot recommend this option, either.
The third time’s a charm, though! The “netCDF format” option worked. I selected for individual files, as you can see in the snapshot above.
There were still some choices to make.
Item “2. CHOOSE DEPTH LEVEL” lets you choose between the observed data and values interpolated to standard depths. The former is the right choice for my purposes.
Item “3 CHOOSE FLAG TYPES” offers two choices. I selected the WOD option, not knowing what the other meant. (I do recommend exploring both options, though.)
Item “4 CHOOSE XBT/MBT corrections” does not apply to CTD data, so I left this at its “No corrections” default value.
And, finally, I gave my email address. This is needed because the next step involves the server preparing the dataset, which can take a while. When the data are prepared, the server sends you an email with a link (or links) to click to download the data. (This server does not seem to satisfy my criterion 3, although I might have missed that option.)
The link in this case led to a gzipped tar file containing a set of NetCDF files, one per station. If you want to analyse the data in the R language, you might want to take a look at a video I made topic (Reference 4) on this topic.
References
- XKCD cartoon about expansion of standards: https://xkcd.com/927/
- Youtube video showing how to do the steps of the present blog posting: https://youtu.be/A9csPU7BWn4
- NOAA site discussed here: https://www.ncei.noaa.gov/access/world-ocean-database-select/dbsearch.html
- Youtube video showing how to handle the downladed netcdf files in R https://www.youtube.com/watch?v=VWAYZGoLjmg&t=0s