Comparing CO2 Datasets
Introduction
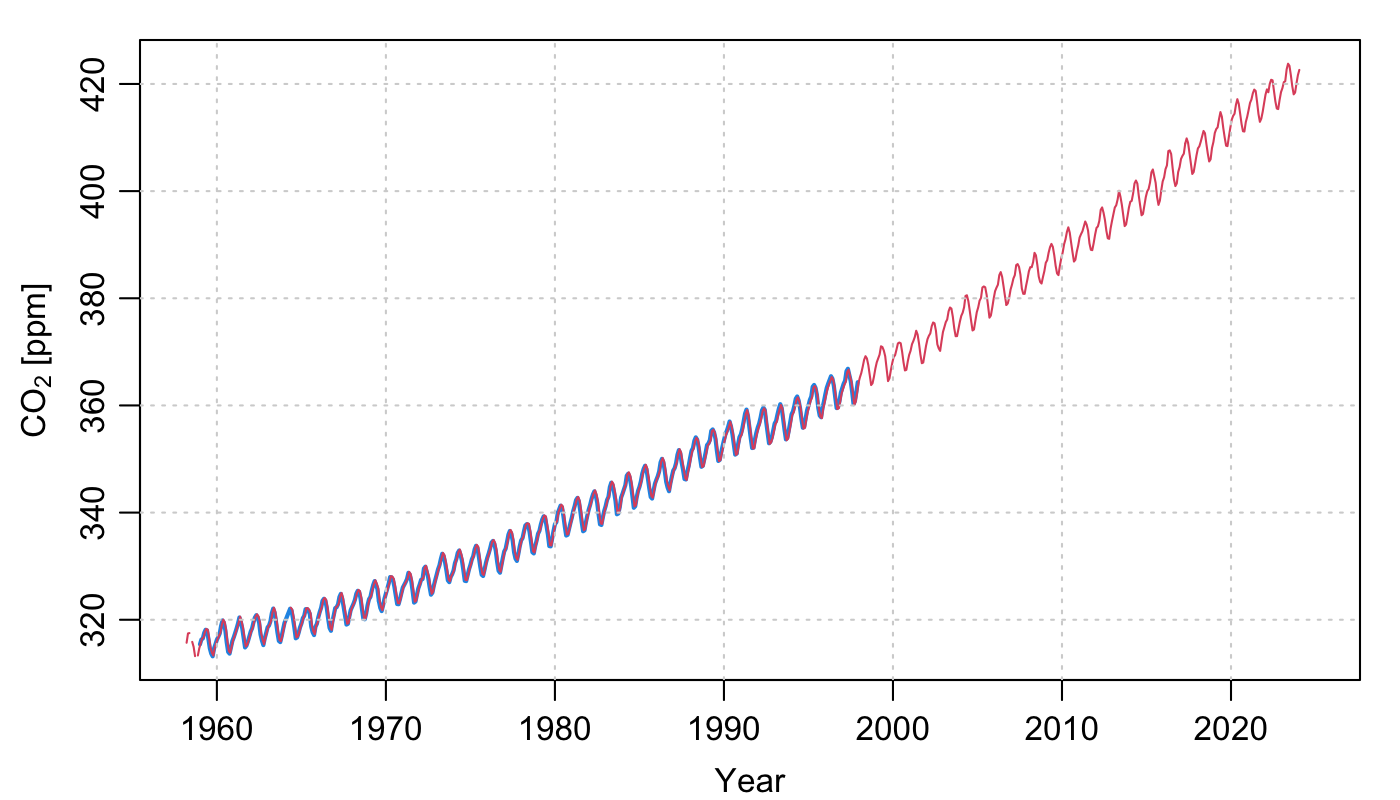
R has a built-in dataset named co2 that starts in the 1950s and ends in the
1990s. Its documentation lists the source as being
https://scrippsco2.ucsd.edu/assets/data/atmospheric/stations/in_situ_co2/monthly/monthly_in_situ_co2_mlo.csv
so I decided to compare the two. I get as below, with code as below the
diagram. Apart from some hickups at the very start, they agree, at least by eye.
So, whenever I want to talk about data(co2) and someone asks about recent
data, I know where to suggest they turn. Hopefully what I have inferred about
this file, downloaded on this date, will still hold in the future.
png("2024-02-19-co2.png", unit = "in", width = 7, height = 4, res = 200)

par(mar = c(3, 3.5, 1, 1), mgp = c(2, 0.7, 0))
# Compare built-in co2 dataset with a new dataset
data(co2)
old <- data.frame(year = as.numeric(time(co2)), co2 = as.vector(co2))

url <- "https://scrippsco2.ucsd.edu/assets/data/atmospheric/stations/in_situ_co2/monthly/monthly_in_situ_co2_mlo.csv"
file <- gsub(".*/", "", url)
if (!file.exists(file)) {
    message("downloading \"", file, "\" from \"", url, "\"")
    download.file(url, file)
}
lines <- readLines(file)
comment <- grepl("^\"", lines)
dataNames <- read.csv(text = lines[!comment][1])
lines <- lines[!comment]
data <- read.csv(text = lines, skip = 3)
new <- data.frame(year = data[, 1] - 1 / 24 + data[, 2] / 12, co2 = data[, 5])
new$co2[new$co2 < 0] <- NA
xlim <- range(c(old$year, new$year))
ylim <- range(c(old$co2, new$co2), na.rm = TRUE)
plot(old$year, old$co2,
    xlim = xlim, ylim = ylim, col = 4, type = "l", lwd = 2,
    xlab = "Year",
    ylab = expression(CO[2] * " [ppm]")
)
lines(new$year, new$co2, col = 2)
grid()