Comparing Albers Equal Area and Lambert Conic Conformal Map Projections
I noticed that the AEA (Albers Equal Area; see reference 1) and LCC (Lambert Conic Conformal; see reference 2) projections looked very similar for a map I was making that spanned about 500 km at mid-latitude. The grid lines were indistinguishable by eye. Rather than show my actual plot, I’ve made up some simple plots for a demonstration here.
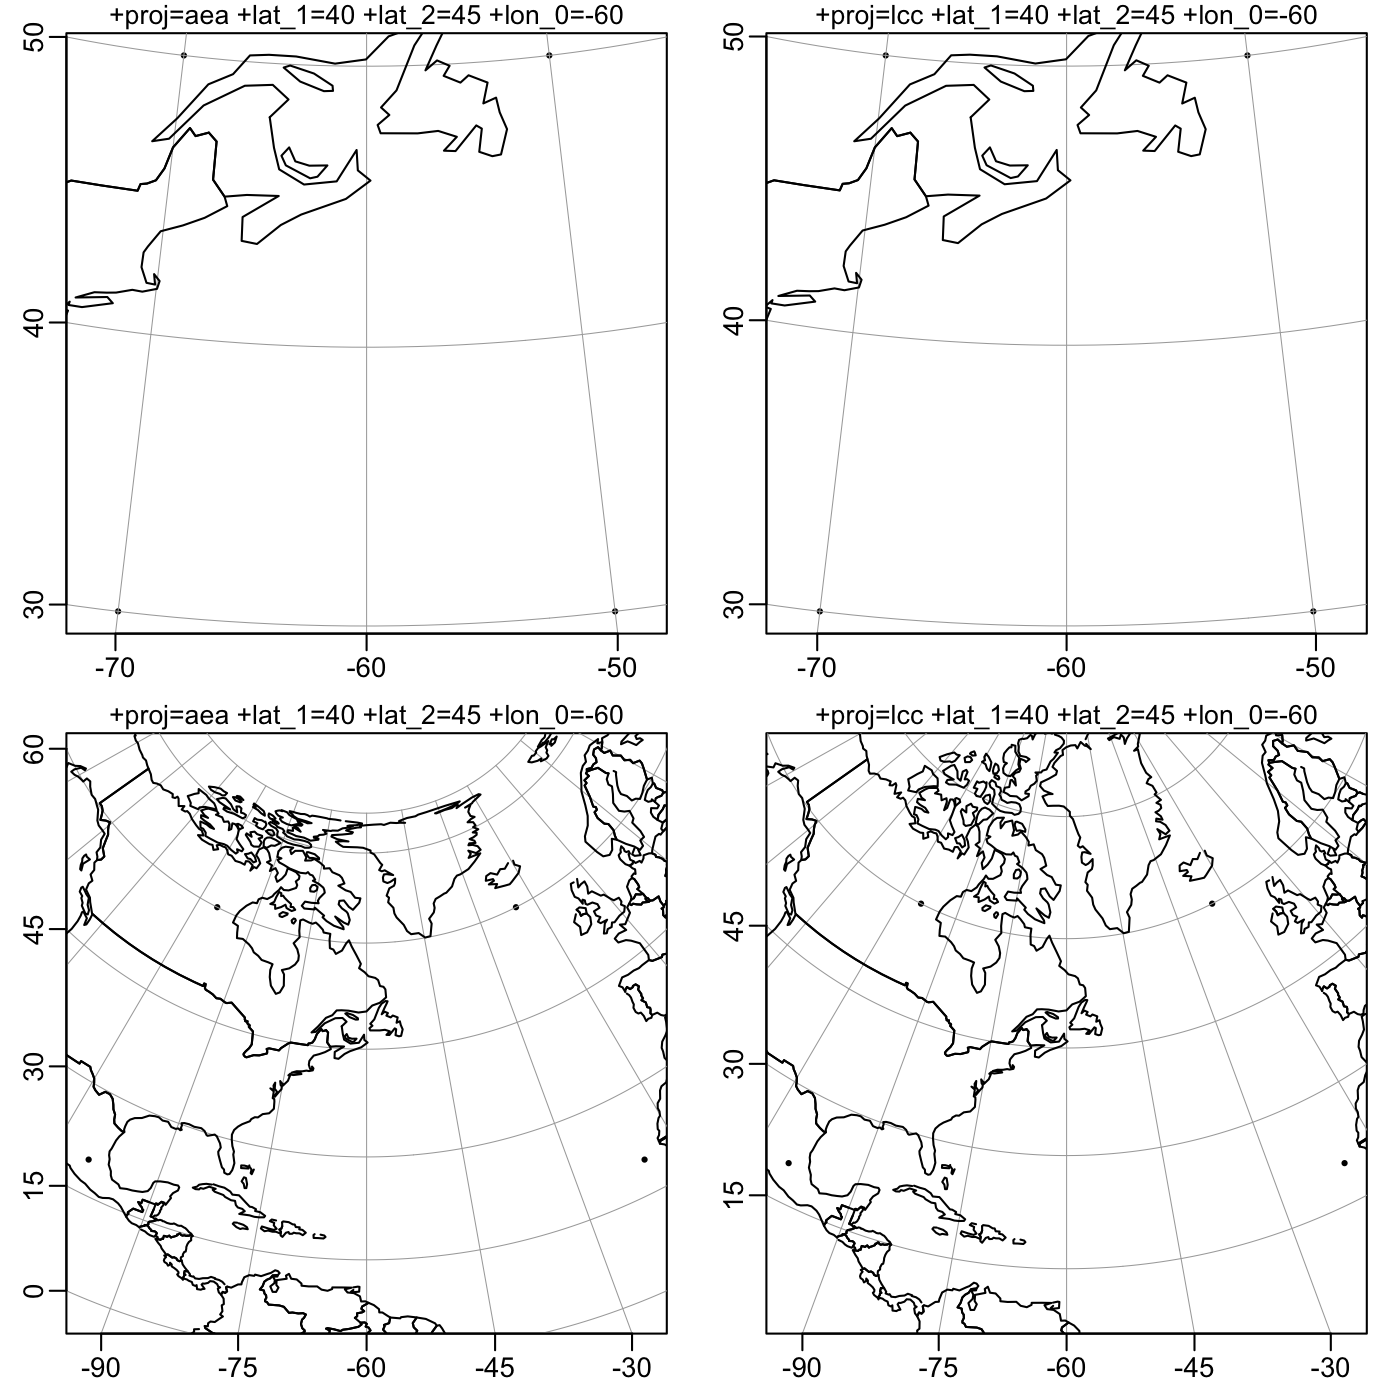
In the following image, the left column is for AEA, the right column is for LCC, with smaller domain in the top row and larger domain in the bottom.
Notice that the grid lines (and the coastlines) are very similar at mid latitudes and below, whereas large differences show up in the most northerly region. Indeed, the north pole appears as a circle in AEA.
References
-
“Albers Equal Area — PROJ 9.3.1 Documentation.” Accessed February 7, 2024. https://proj.org/en/9.3/operations/projections/aea.html
-
“Lambert Conformal Conic — PROJ 9.3.1 Documentation.” Accessed February 7, 2024. https://proj.org/en/9.3/operations/projections/lcc.html
Appendix: R code to make the plot
library(oce)
data(coastlineWorld)
lon <- coastlineWorld[["longitude"]]
lat <- coastlineWorld[["latitude"]]
png("2024-02-07-map-projections.png", width = 7, height = 7,
    unit = "in", res = 200)
lonS <- c(-70, -70, -50, -50)
lonL <- lonS + c(-30, -30, 30, 30)
latS <- c(30, 50, 30, 50)
latL <- latS + c(-10, 10, -10, 10)
proj1 <- "+proj=aea +lat_1=40 +lat_2=45 +lon_0=-60"
proj2 <- "+proj=lcc +lat_1=40 +lat_2=45 +lon_0=-60"
par(mfrow = c(2, 2), mar = c(2, 2, 1, 1), mgp = c(2, 0.7, 0))
cex <- 0.8
mapPlot(lonS, latS, proj = proj1, type = "p", cex = 0.5, pch = 20)
mapLines(lon, lat)
mtext(proj1, side = 3, line = 0.1, cex = cex)

mapPlot(lonS, latS, proj = proj2, type = "p", cex = 0.5, pch = 20)
mapLines(lon, lat)
mtext(proj2, side = 3, line = 0.1, cex = cex)

mapPlot(lonL, latL, proj = proj1, type = "p", cex = 0.5, pch = 20)
mapLines(lon, lat)
mtext(proj1, side = 3, line = 0.1, cex = cex)

mapPlot(lonL, latL, proj = proj2, type = "p", cex = 0.5, pch = 20)
mapLines(lon, lat)
mtext(proj2, side = 3, line = 0.1, cex = cex)
dev.off()