Scotian Shelf Bathymetry in Shaded View
The code at the bottom of this posting makes two diagrams for displaying the bathymetry (i.e. the water depth) near Nova Scotia.
Figure 1 is a shaded view of ocean bathymetry, in which the colouring evokes how the bottom might look if drained of water and illuminated by a glancing light shining diagonally from the top-left corner. This sort of diagram can be effective in communicating qualitative impression of depth patterns.
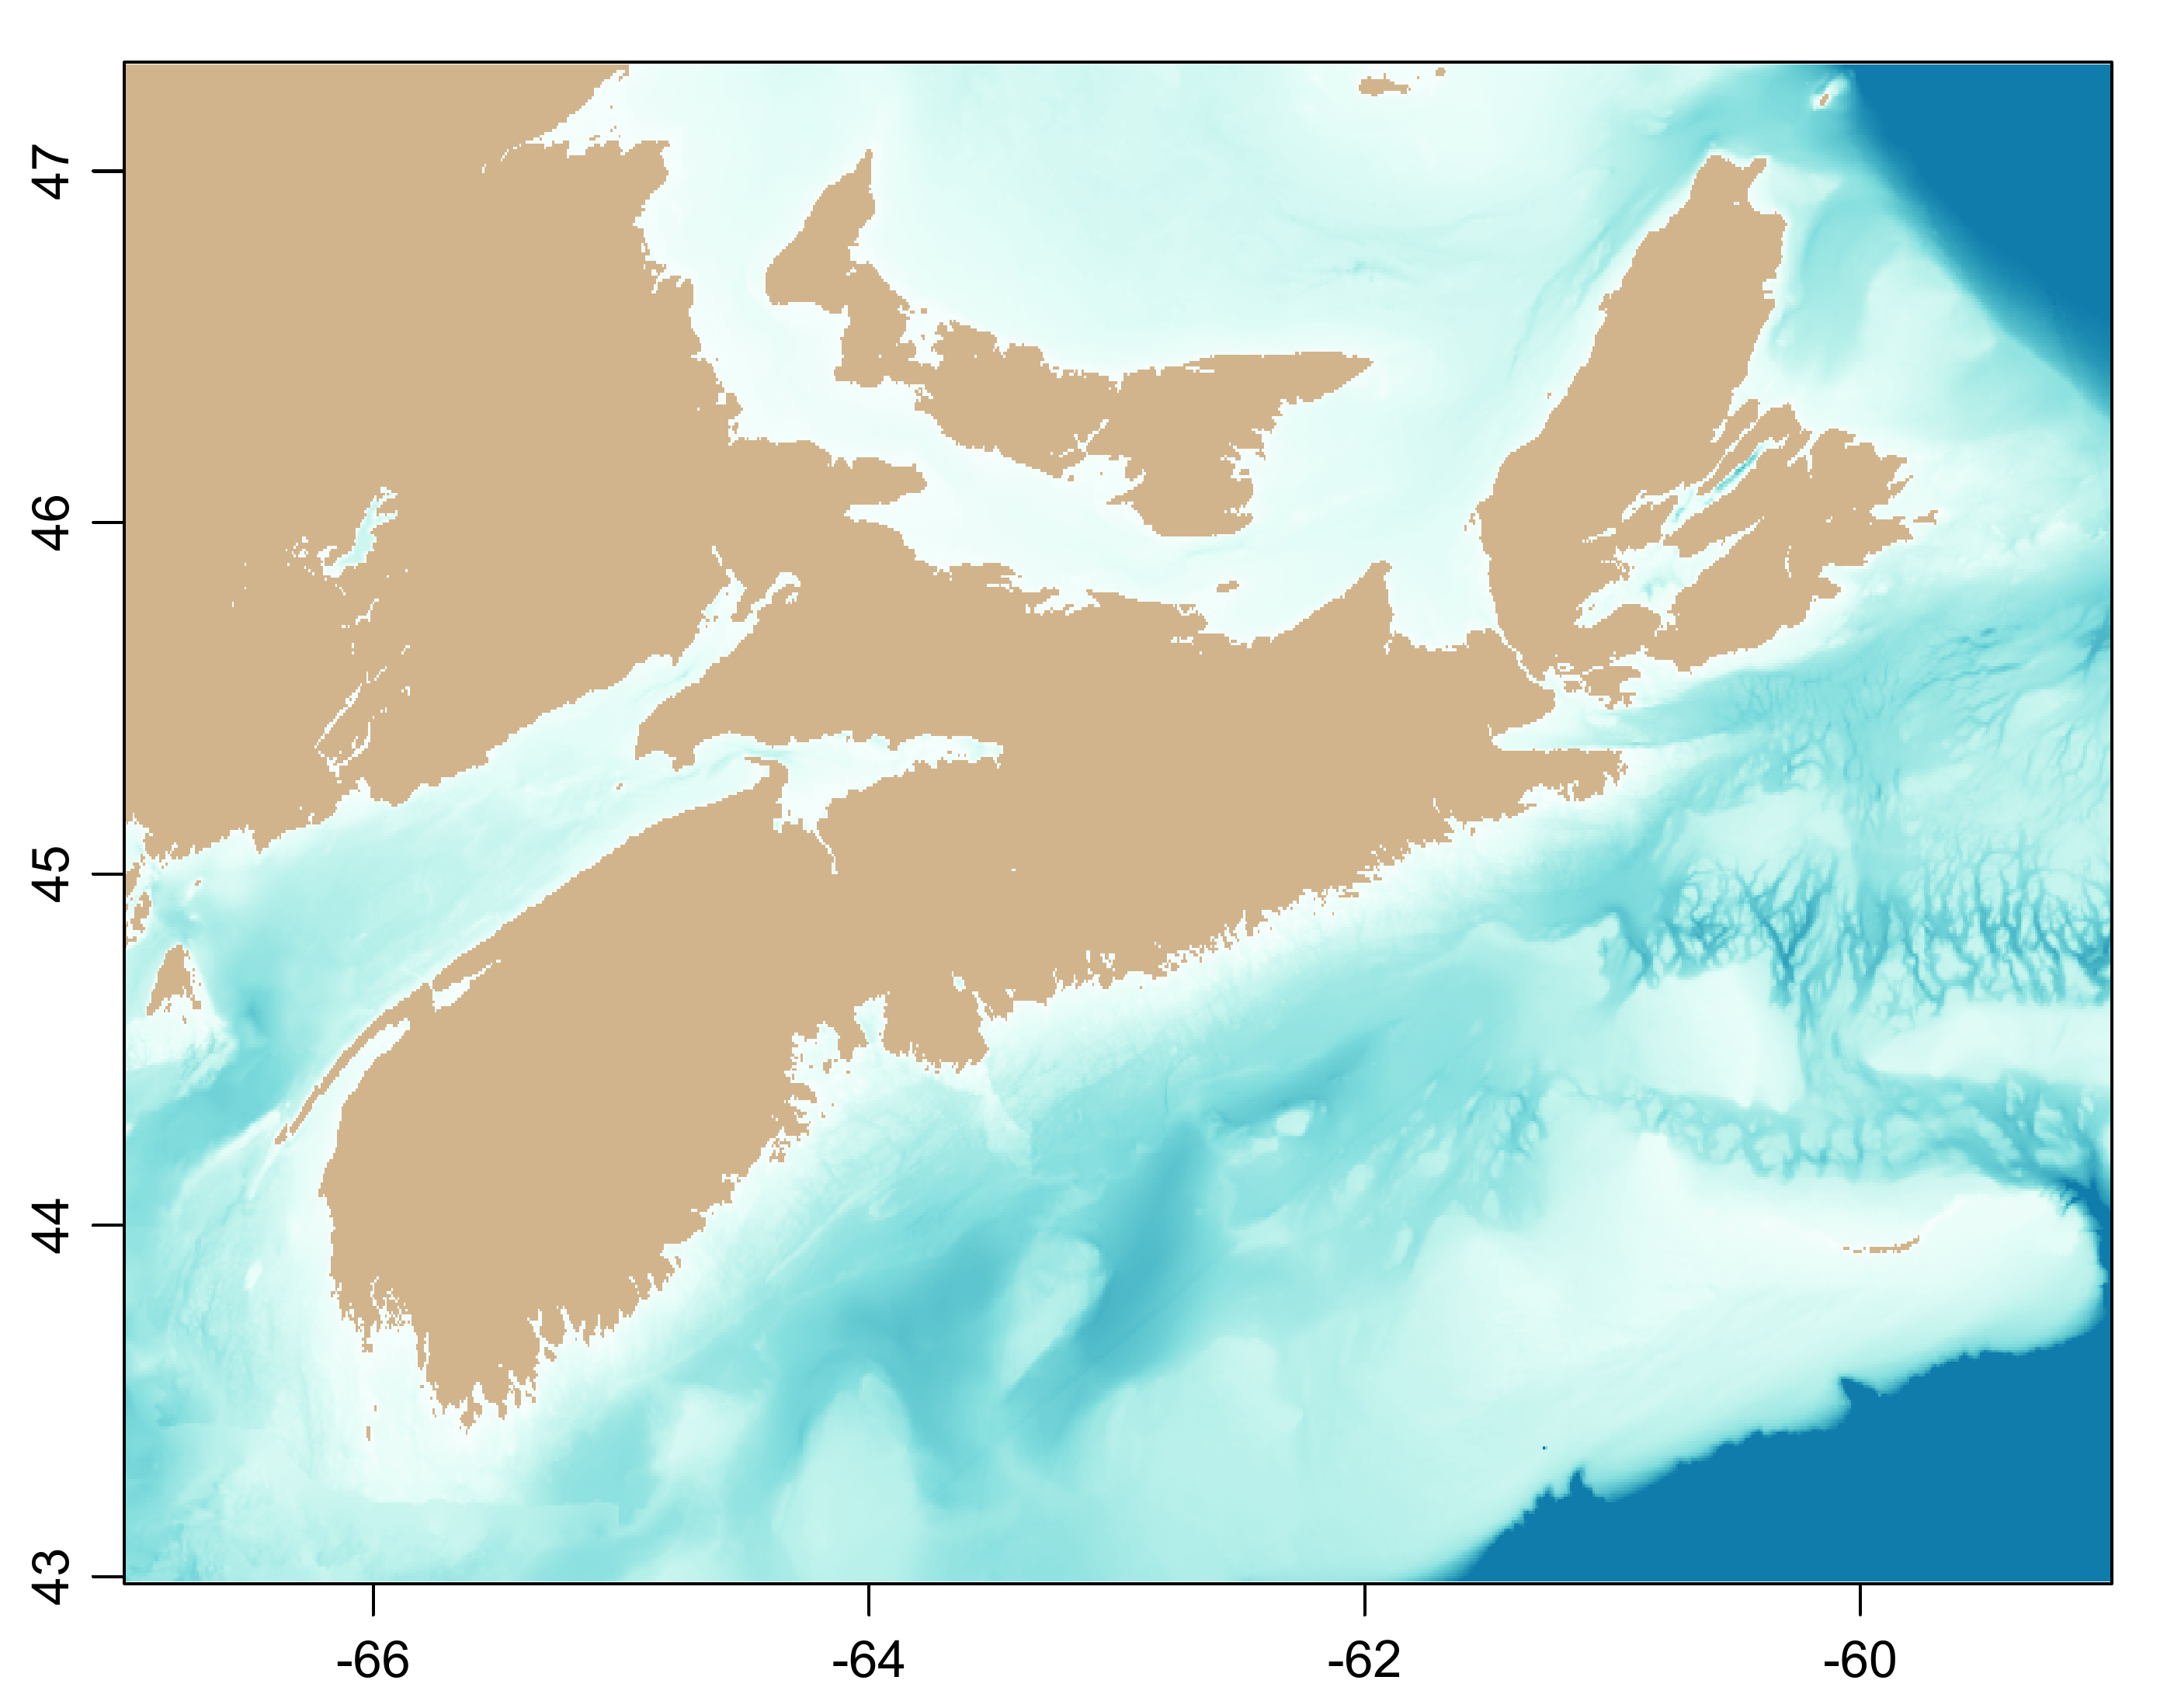
On the other hand, Figure 2 represents depth directly, by colour. Paired with a colour palette and perhaps superimposed contours or banded colours, such diagrams have the advantage of providing a quantitative indication of depth at any given location.
Which representation is better? I think the answer depends on the application. For a scientific paper, I would use something like Figure 2, with a colour palette, and perhaps with added contours. But for a non-technical audience or in an application where the depth patterns are the prime interest, I might use something like Figure 1. And it might be useful to think of ways to combine the two approaches…
Figure 1. Shaded view
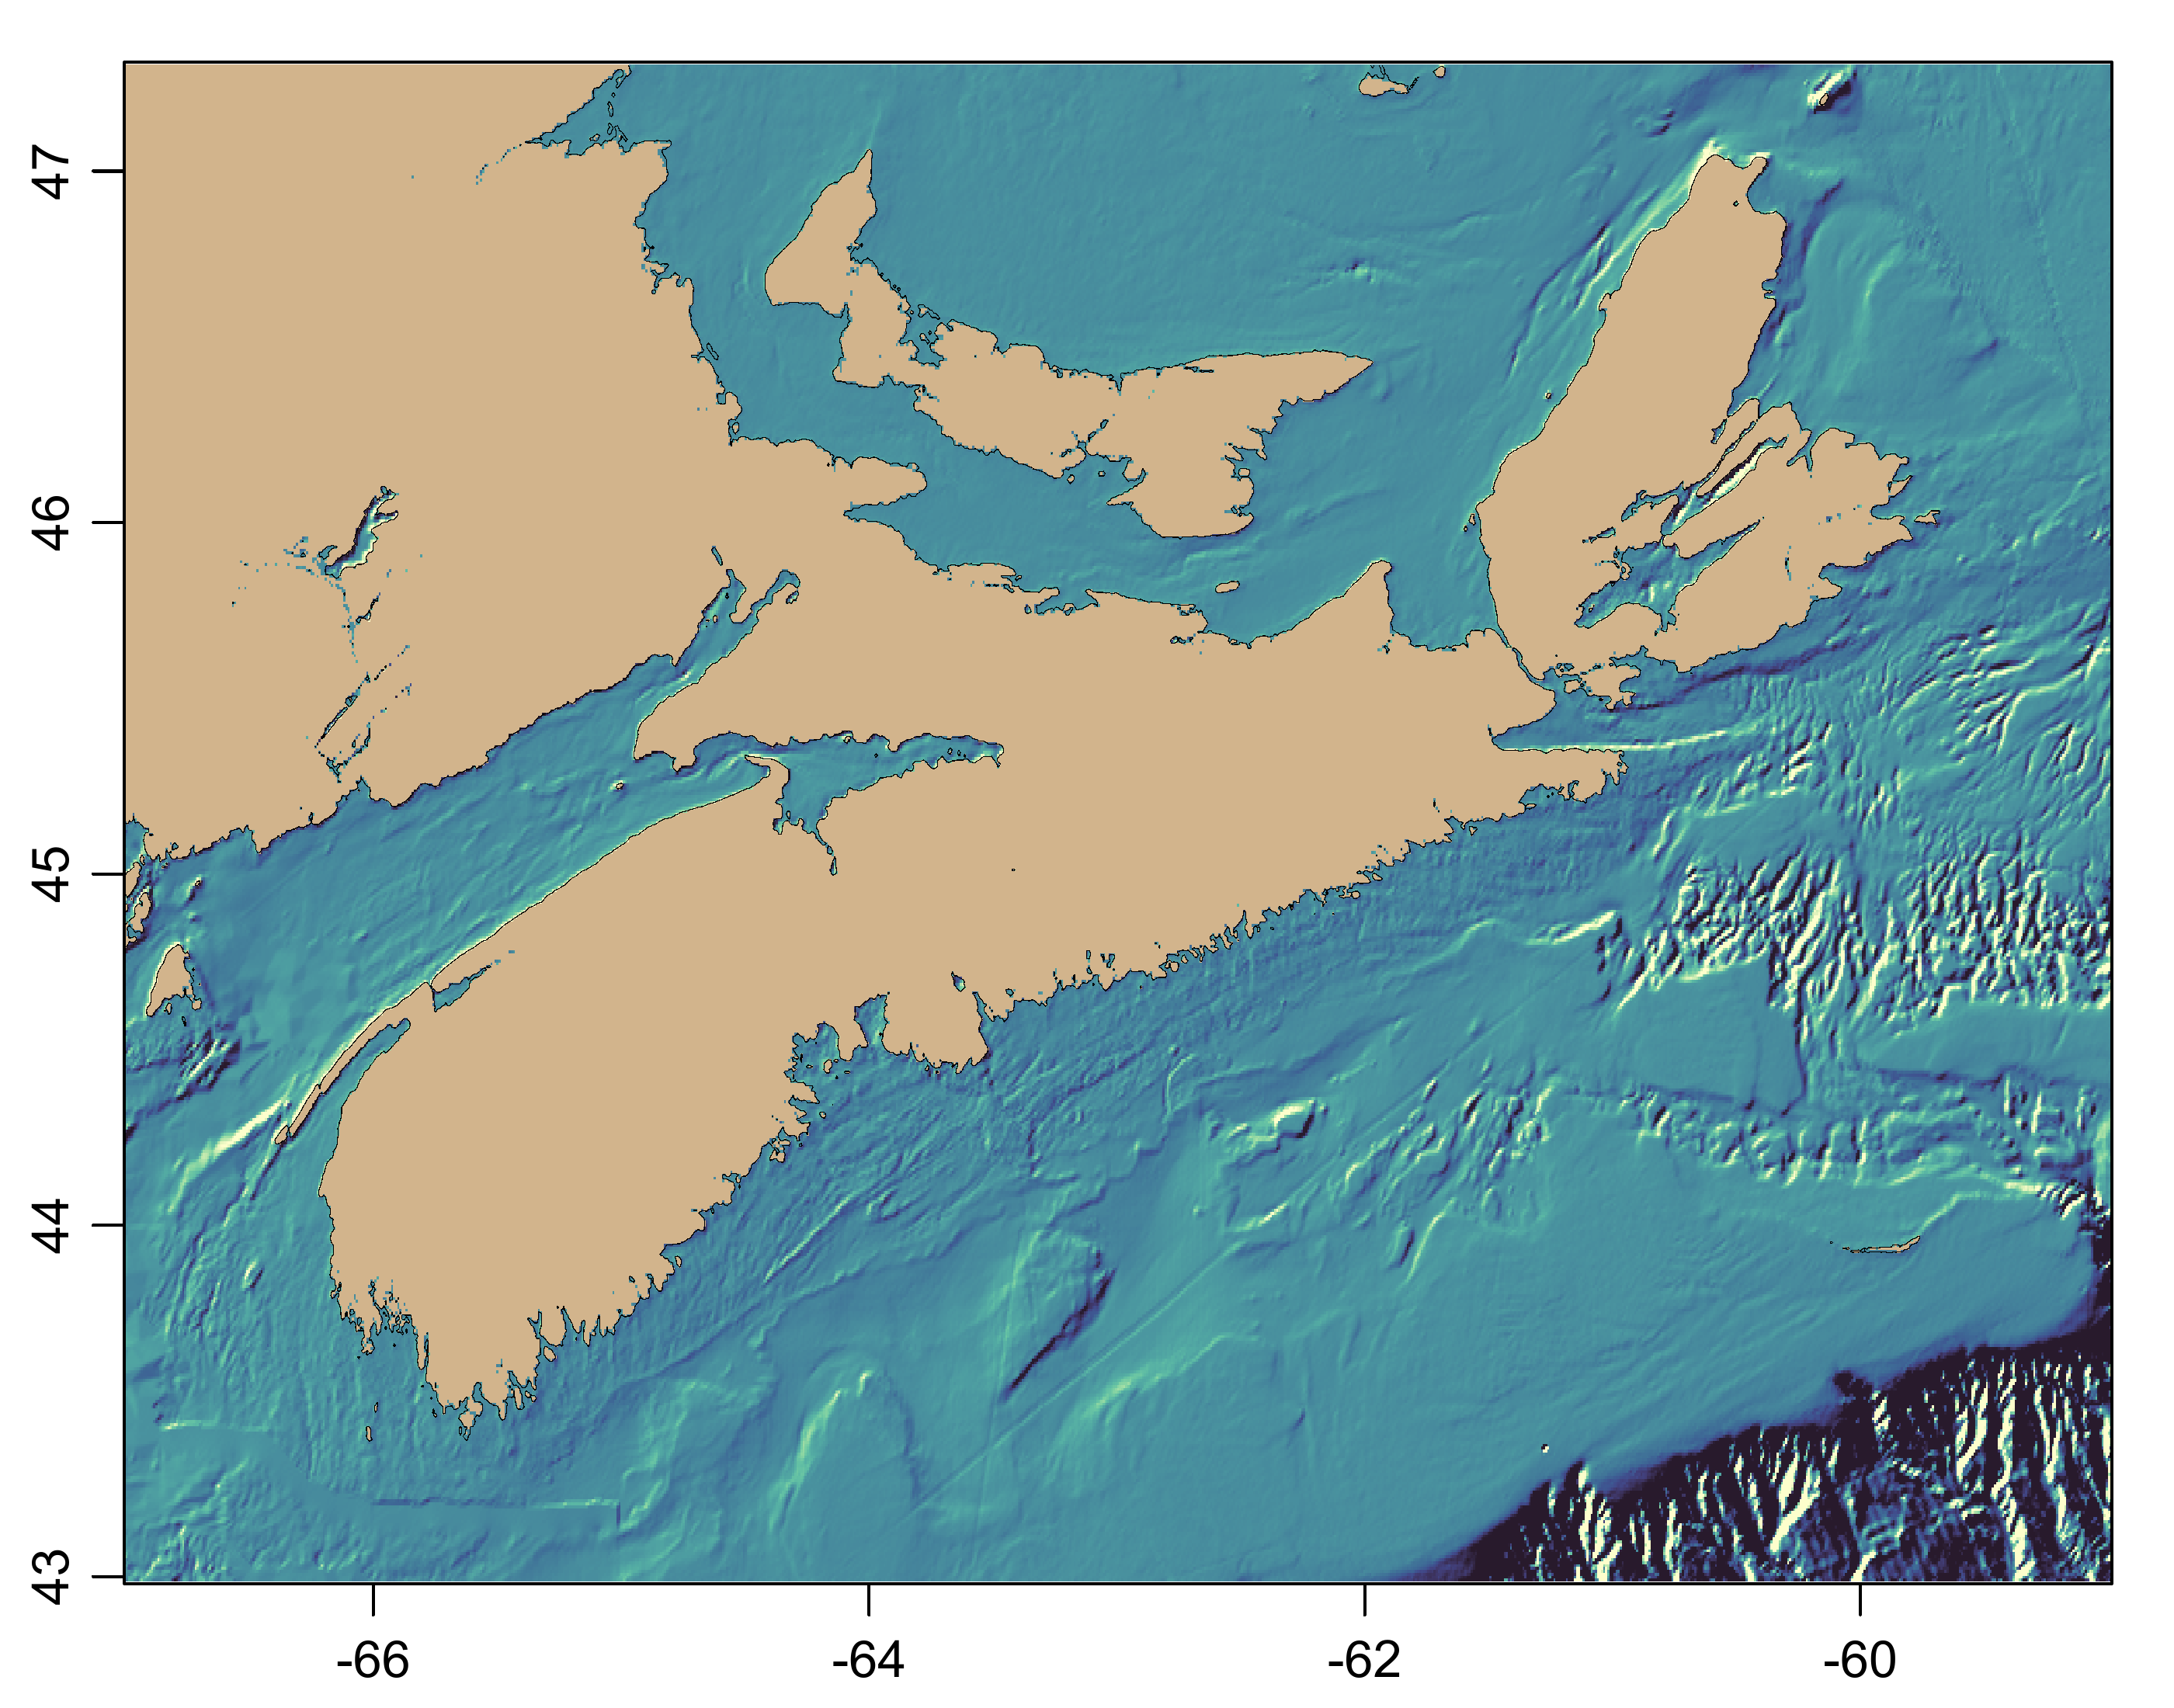
Figure 2. Shaded view
Q <- 0.95 # quantile for slope cutoff
library(oce)
library(dod)
topoFile <- dod.topo(-67, -59, 43, 47.3, resolution = 0.5)
topo <- read.topo(topoFile)
x <- topo[["longitude"]]
y <- topo[["latitude"]]
z <- topo[["z"]]
land <- z > 1
asp <- 1 / cos(mean(y) * pi / 180)

g <- grad(z, x, y)
G <- asp * g$gx - g$gy # note the asp term
zlim <- quantile(abs(G), Q) * c(-1, 1)
G[land] <- NA
if (!interactive()) {
    png("topo_SS_%d.png",
        width = 7, height = 5.5, unit = "in", res = 400,
        type = "cairo", antialias = "none", family = "Arial"
    )
}
imagep(x, y, G,
    asp = asp, zlim = zlim,
    col = cmocean::cmocean("deep", direction = -1),
    decimate = FALSE,
    missingColor = "tan",
    mar = c(2.0, 2.0, 1.0, 1.0),
    drawPalette = FALSE
)
contour(x, y, z,
    levels = 0, drawlabels = FALSE,
    add = TRUE, lwd = 0.3
)
bathy <- z
bathy[bathy > 0] <- NA
imagep(x, y, bathy,
    zlim = c(-400, 0),
    asp = asp,
    col = oceColorsGebco,
    decimate = FALSE,
    missingColor = "tan",
    mar = c(2.0, 2.0, 1.0, 1.0),
    drawPalette = FALSE
)
if (!interactive()) {
    dev.off()
}