2016 US election by education level
Introduction
There was much to learn from studying how the 2016 USA presidential election campaign unfolded. The final results have not been tallied to date, although the outcome is clear now.
As an educator, I am particularly curious about possible linkages between educational level and voting preference. This is a matter covered in various exit polls and other studies, but I wanted to get into the data myself.
With this motivation, I downloaded state-by-state education data and voting data from references 1 and 2, and stored them in this blog, so that the R code I present at the end can make the following graph.
My focus was on the percentage of the population educated beyond the Bachelor level, since that proved to be the educational variable with the highest explanatory power.
As a measure of voting preference, I constructed an index defined as (D-R)/(D+R) where D is the number of votes cast for the Democrat, and R is the number cast for the Republican. This index is zero in a tied state, with positive values indicating a preference for Clinton and negative values a preference for Trump. By definition, the index is bound to lie between -1 and +1, i.e. between 100% votes for the Republican and 100% for the Democrat. I did not perform regression analysis, because it is not clear what that would mean if applied to this index.
Results
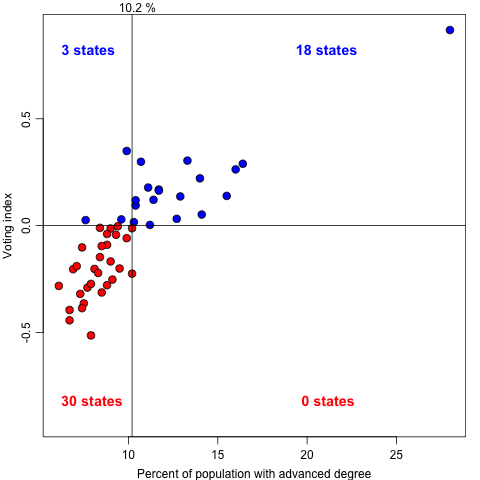
In the resultant graph, the vertical line indicates an educational level of 10.2%, which was chosen by visual inspection as a divider between Trump-favouring and Clinton-favouring educational levels. The blue dots indicate a preference for Clinton over Trump.
A noticeable feature is the isolated point indicating high educational level and strong preference for Clinton. This is the District of Columbia, which may have a particular reason to favour Clinton, since Trump has pledged to “drain the swamp.”
The overall data cloud reveals a clear preference for Clinton in states with higher educational level.
Focussing on which candidate won the count, it is possible to construct a simple statement about the results of this election.
-
In 18 of the 18 states in which 10.2% or more of the population holds an advanced degree, Clinton is favoured over Trump.
-
Trump is favoured in 30 of the remaining 33 states.
Conclusions
Clinton won a majority of the votes in states with high educational levels.
Code
dir <- "https://raw.githubusercontent.com/dankelley/dek_blog/main/docs/assets/data"
ed <- paste0(dir, "/usa-election-2016-education.csv")
vo <- paste0(dir, "/usa-election-2016-votes.dat")

# Educational-level data, downloaded from
#   http://www.ers.usda.gov/webdocs/DataFiles/CountyLevel_Data_Sets_Download_Data__18026//Education.xls
# on Nov 10, 2016.
ee <- read.csv(ed, skip = 5, header = FALSE, encoding = "utf8", stringsAsFactors = FALSE)

# Use 'letters' to simplify lookup in CSV file.
l <- letters
e <- data.frame(
    state = ee[, 1],
    highschool = ee[, which(l == "t")],
    bachelor = ee[, which(l == "u")],
    advanced = ee[, which(l == "v")]
)
# Trim USA total, and some lines at bottom
education <- e[seq(2, nrow(e) - 2), ]

# Voting data, downloaded by cutting and pasting a table at
#   http://www.nbcnews.com/politics/2016-election/president
# downloaded as of 1611h AST on Nov 10, 2016. (NOTE: the
# text had '%' characters in several columns, but these
# were deleted.)
votes <- read.delim(vo,
    sep = "\t", header = FALSE,
    stringsAsFactors = FALSE,
    col.names = c(
        "state", "electoralVotes",
        "percentIn", "Clinton", "Trump"
    )
)
votes$ratio <- votes$Clinton / votes$Trump
votes$index <- ifelse(votes$ratio > 1, votes$ratio - 1, -1 / votes$ratio + 1)
votes$index <- (votes$Clinton - votes$Trump) / (votes$Clinton + votes$Trump)

# Check that tables are aligned
stopifnot(length(votes$state) == sum(votes$state == education$state))

png("2016-11-10-election-usa-2016.png")
par(mar = c(3, 3, 1, 1), mgp = c(2, 0.7, 0))

# what was the outlier?
subset(education, advanced > 20)
# Oh, DC...
DC <- which(education$advanced > 20)
# How did they vote in DC?
votes[DC, ]

division <- 10.2
H <- education$advanced > division # from visual inspection
Hdem <- votes$index[H] > 0
Hrep <- votes$index[H] < 0
Ldem <- votes$index[!H] > 0
Lrep <- votes$index[!H] < 0

plot(education$advanced, votes$index,
    ylim = c(-1, 1) * max(abs(votes$index)),
    pch = 21, cex = 1.4,
    bg = ifelse(votes$index > 0, "blue", "red"),
    xlab = "Percent of population with advanced degree",
    ylab = "Voting index"
)
abline(h = 0)
abline(v = division)
mtext(paste(sum(Hdem), "states"),
    side = 3, line = -3, adj = 0.7, font = 2, cex = 1.2, col = "blue"
)
mtext(paste(sum(Hrep), "states"),
    side = 1, line = -3, adj = 0.7, font = 2, cex = 1.2, col = "red"
)
mtext(paste(sum(Ldem), "states"),
    side = 3, line = -3, adj = 0.05, font = 2, cex = 1.2, col = "blue"
)
mtext(paste(sum(Lrep), "states"),
    side = 1, line = -3, adj = 0.05, font = 2, cex = 1.2, col = "red"
)
mtext(paste(division, "%"), side = 3, line = 0, at = 10.5)
Reference and resources
-
Source of educational-level data: http://www.ers.usda.gov/webdocs/DataFiles/CountyLevel_Data_Sets_Download_Data__18026//Education.xls
-
Website with a table providing 2016 election results: http://www.nbcnews.com/politics/2016-election/president