Trimming CTD files with shiny
Introduction
The shiny library provides a graphical user interface (GUI) for the R language that may open up new possibilities for human judgement in data filtering, as well as for the use of R by those who choose not to learn its syntax. The first category is the intended audience here, in this first of a series of blog postings about using shiny for Oceanography.
Consider the task of finding the downcast portion of a CTD cast. This must be done because raw CTD data typically include measurements that are of limited value. At the start of a dataset, it is typical to have measurements made during a sensor-equilibration phase, during which the instrument is held just below the water surface for a minute or so. This is followed by a descent through the water column, ideally at almost uniform speed, and, after that, by an ascent phase. In most cases, only the descent phase is of direct interest, so a first step in processing is usually to isolate this phase.
The ctdTrim() function in the oce
library often does a good job of locating
the descent phase, and trimming data recovered before and after. However, this
function is somewhat limited, employing an ad-hoc algorithm that has parameters
that were calibrated on a limited dataset, guided by the eye of a single
analyst. Since deep-sea CTD casts take an hour or two to acquire (i.e. cost
several thousand dollars of ship time), it is entirely reasonable to pay a
technician for a minute or two, to check the results, or to supplant them,
based on visual inspection of the data.
This suggests that CTD trimming might be good demonstration of shiny. As I’m
just learning the system, the methodology is crude. I wanted to learn how to
use slider bars, so I use sliderInput() to select the downcast. I wanted to
learn how to use a file-choice dialog, so I used file.choose() for that.
I am not going to explain the code in any detail. Readers unfamiliar with R will understand very little, I fear, but my purpose is not to replace the dozens of textbooks and online materials that teach R. My purpose is to provide code that might be useful.
library(oce)
library(shiny)
ui <- shinyUI(fluidPage(verticalLayout(
    plotOutput("ctdTrimPlot"),
    wellPanel(
        sliderInput("top", "top fraction percent:",
            min = 0, max = 100, value = 0, step = 0.1
        ),
        sliderInput("bottom", "bottom fraction percent:",
            min = 0, max = 100, value = 100, step = 0.1
        )
    )
)))

#    file <- file.choose()
#    ctdRaw <- read.oce(file)
data(ctdRaw, package = "oce")

server <- function(input, output, session) {
    top <- reactive({
        as.numeric(input$top)
    })
    bottom <- reactive({
        as.numeric(input$bottom)
    })
    trimmed <- ctdRaw
    output$ctdTrimPlot <- renderPlot(
        {
            layout(matrix(c(1, 2, 3, 4, 4, 4), nrow = 2, byrow = TRUE))
            index <- seq_along(ctdRaw[["pressure"]])
            indexStart <- index[1] + 0.01 * top() * diff(range(index))
            indexEnd <- index[1] + 0.01 * bottom() * diff(range(index))
            trimmed <- ctdTrim(ctdRaw, method = "index", parameters = c(indexStart, indexEnd))
            plotProfile(trimmed,
                xtype = "temperature",
                mar = c(0.2, 2.2, 2.5, 0.8), mgp = c(1.2, 0.3, 0)
            )
            plotProfile(trimmed,
                xtype = "salinity",
                mar = c(0.2, 2.2, 2.5, 0.8), mgp = c(1.2, 0.3, 0)
            )
            plotTS(trimmed,
                mar = c(2.2, 2.2, 1.0, 0.8), mgp = c(1.2, 0.3, 0)
            )
            plotScan(ctdRaw,
                mar = c(2.5, 2.5, 0.8, 0.8), mgp = c(1.2, 0.3, 0)
            )
            suggested <- range(ctdTrim(ctdRaw)[["scan"]])
            abline(v = suggested, lty = 2, col = c("red", "blue"))
            abline(v = c(indexStart, indexEnd), col = c("red", "blue"))
            legend("topright", c(
                suggested[1], indexStart,
                suggested[2], indexEnd
            ),
            col = c("red", "red", "blue", "blue"),
            lty = c(2, 1, 2, 1),
            legend = c(
                "Start (suggested)",
                sprintf("Start (user): %.0f", indexStart),
                "End (suggested)",
                sprintf("End (user): %.0f", indexEnd)
            )
            )
        },
        pointsize = 20
    )
}

shinyApp(ui = ui, server = server)
Interested users might start with the above, and then uncomment the
file.choose() block to work with their own files. Saving the
data needs to be considered as well, but that will depend very
much on local practices – save to an RDA file? save a database
item with the trimming start and stop? insert flags and store
in SBE format? etc.
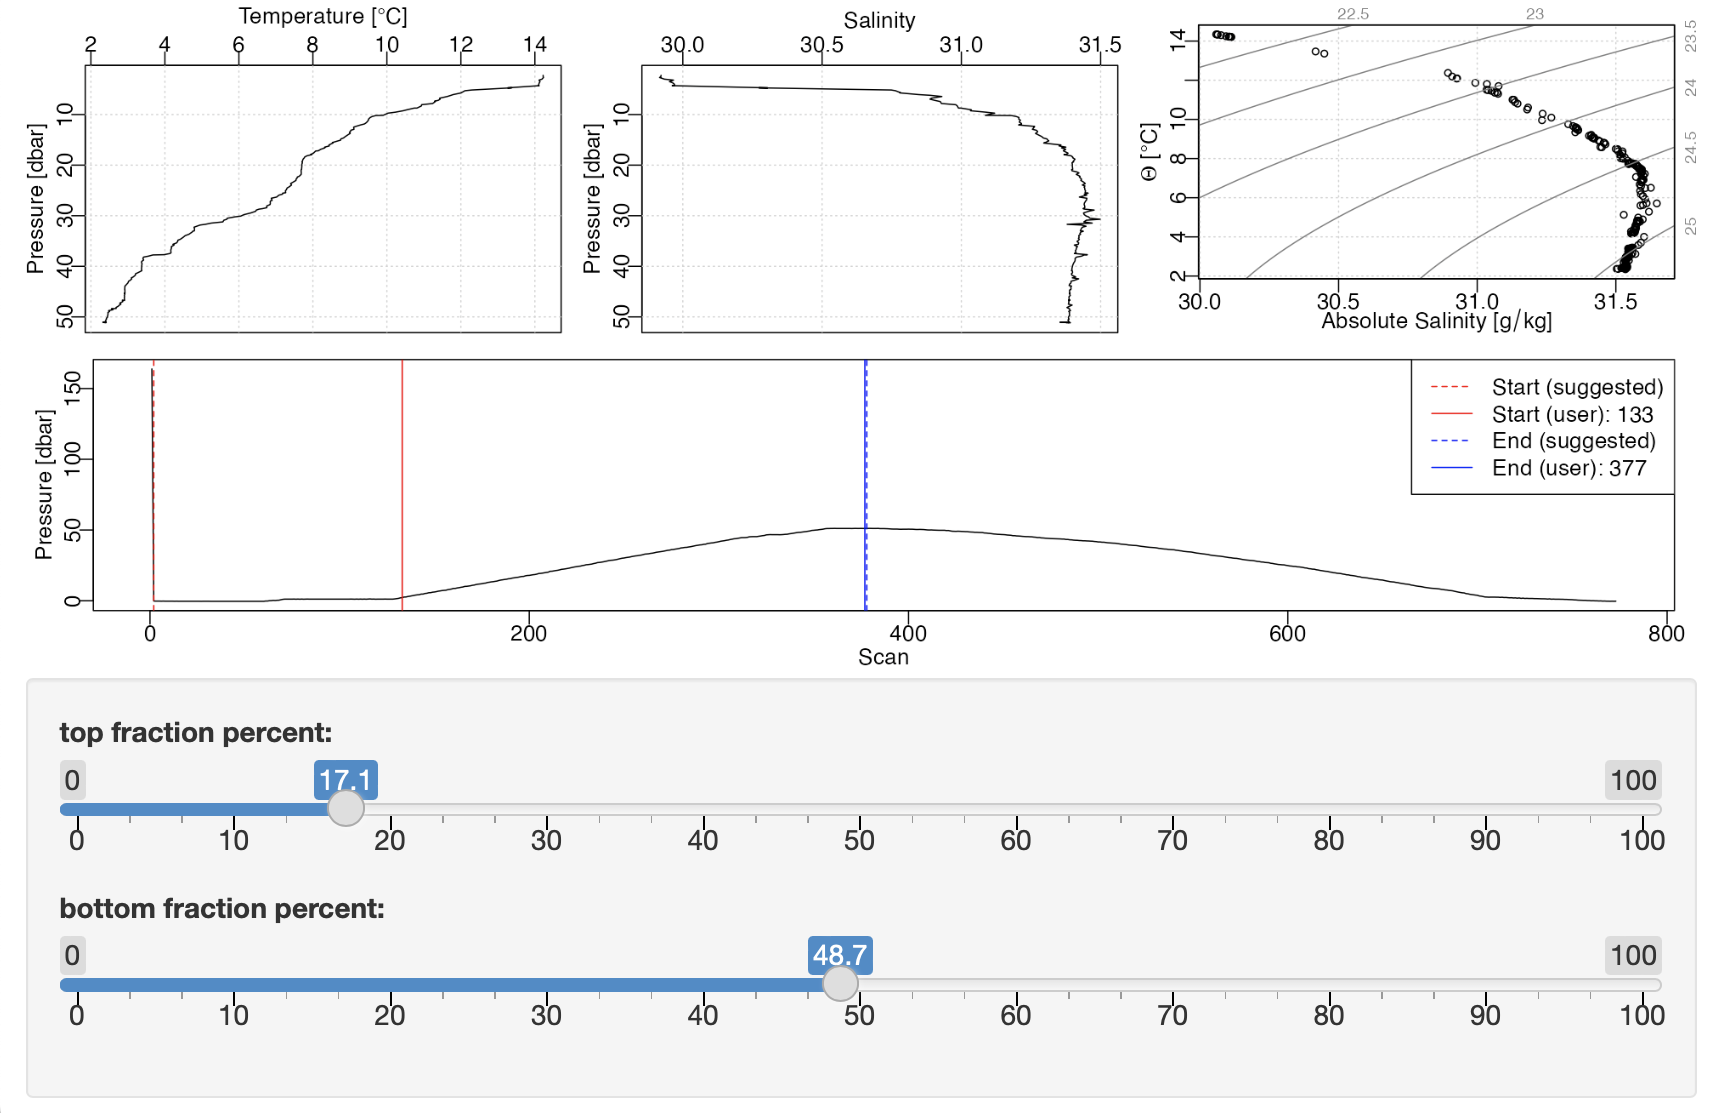
Example initial view
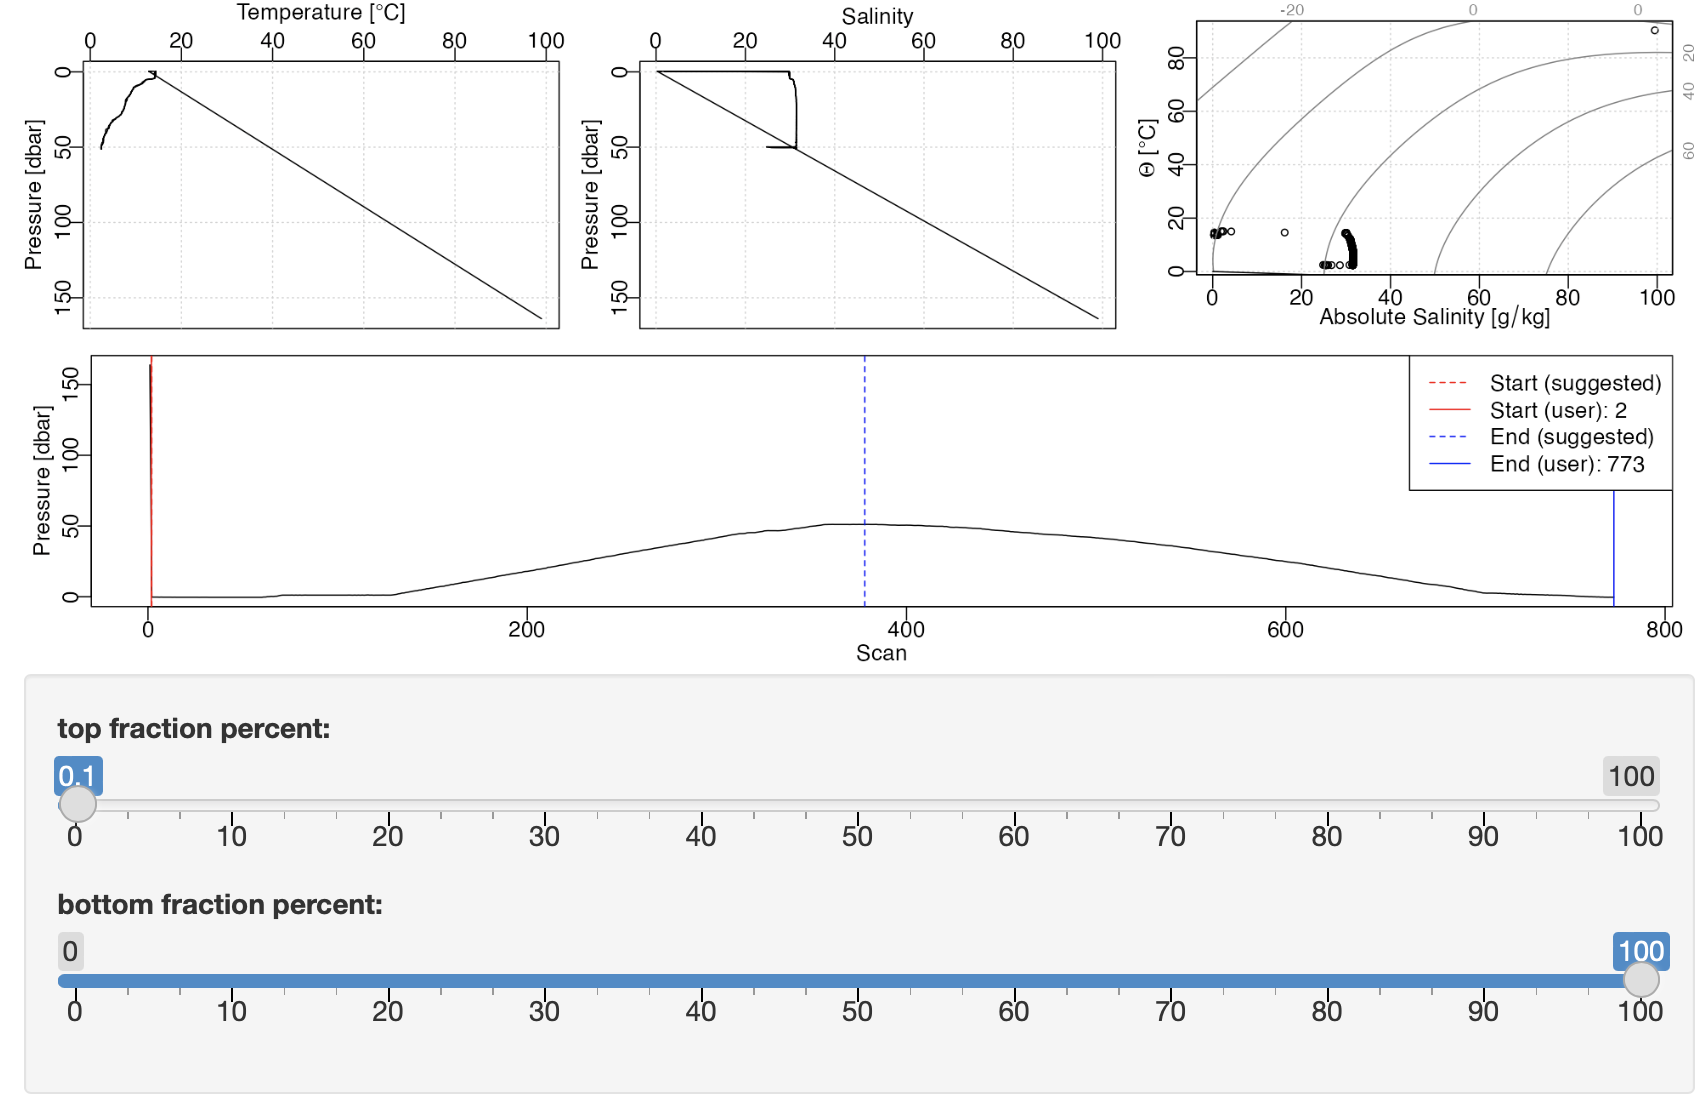
Example trimmed view