Solar eclipse
Introduction
Today there was a solar eclipse that was not visible on my side of the Atlantic, but was seen on the European side, either as a partial eclipse, towards the south, or a total one, towards the north [1]. Eclipses being rare and solar power being a new thing, this event caused unprecedented reduction of solar power [2].
A good spot for viewing the total eclipse was Longyearbyen, on Svalbard, and readers seeking good images might want to include that name in web searches. (I could not find open-source images at the time of writing, but of course that was not really my goal in this blog posting…)
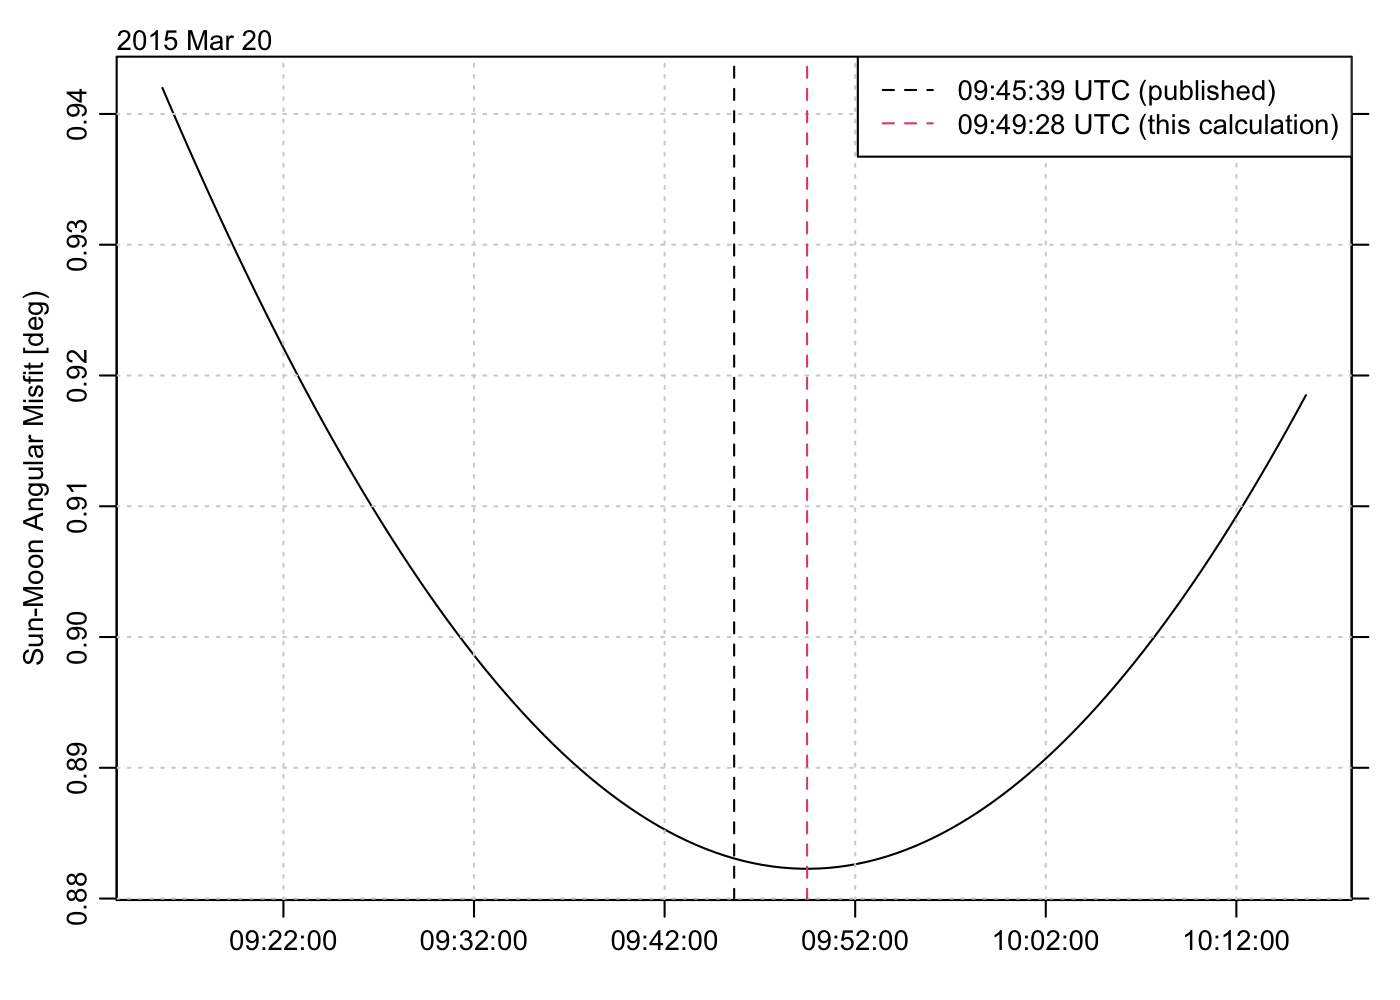
I thought it might be interesting to see whether the sun and moon functions in the oce package could reproduce the eclipse timing, so I constructed a function to measure the mismatch between sun and moon position in the sky, and set up an optimization problem to find the time of least mismatch.
The oce functions sunAngle() and moonAngle() are at the heart of the work.
Each returns a list that contains, among other things, altitude and
azimuth. I set up a mismatch function to calculate a combination of these,
with a scale factor to account for the convergence of lines of constant
azimuth.
Below is the code, and the graph it makes. The official time and the time inferred here differ by approximately 4 minutes. I suspect this is because of the approximate nature of the formulae in oce (see the documentation for the functions used).
References and resources
-
Overview of eclipse (wikipedia).
-
Effect of eclipse on power grids (reuters).
-
Image from NASA showing eclipse details, including timing.
Appendix: code
library(oce)

# From a website
tofficial <- as.POSIXct("2015-03-20 9:45:39", tz = "UTC")

# Angle misfit function
angle <- function(t, lon = 15 + 40 / 60, lat = 78 + 12 / 60) {
    sa <- sunAngle(t, longitude = lon, latitude = lat, useRefraction = TRUE)
    ma <- moonAngle(t, longitude = lon, latitude = lat)
    saz <- sa$azimuth
    sal <- sa$altitude
    maz <- ma$azimuth
    mal <- ma$altitude
    scale <- cos(0.5 * (ma$altitude + sa$altitude) * pi / 180)
    sqrt((scale * (saz - maz))^2 + (sal - mal)^2)
}
# Variation over 2 hours
times <- tofficial + seq(-1800, 1800, 30)
misfit <- sapply(times, function(t) angle(t))
interval <- tofficial + c(-1800, 1800)
# Best fit
o <- optimize(function(t) angle(t), interval = interval)
# Plot
png("2015-03-20-eclipse.png", unit = "in", width = 7, height = 5, res = 200, pointsize = 10)
oce.plot.ts(times, misfit,
    xlab = "",
    ylab = "Sun-Moon Angular Misfit [deg)",
    pch = 20, drawTimeRange = FALSE, grid = TRUE
)
tbest <- as.POSIXct(o$minimum)
abline(v = tbest, col = 2, lty = 2)
abline(v = tofficial, lty = 2)
mtext(text = format(tofficial, "%Y %b %d"), adj = 0)
legend("topright",
    lwd = 1, lty = 2, col = 1:2, bg = "white",
    legend = c(
        format(tofficial, "%H:%M:%S UTC (published)", tz = "UTC"),
        format(tbest, "%H:%M:%S UTC (this calculation)", tz = "UTC")
    )
)