Inferring Halocline Depth
Introduction
There are no agreed-upon methods for inferring halocline depth, but a
reasonable method might involve locating the depth at which dS/dp is largest,
where S is salinity and p is pressure. Calculating the derivative using
e.g. diff(S)/diff(p) can be problematic because of sensitivity to noise,
especially for data that have not been smoothed or bin-averaged. Achieving
smoothness with conventional filtering has problems at the end-points, which is
particularly troublesome for a near-surface halocline (as discussed in another
blog entry). A possible solution to such problems is to calculate the
derivative with a smoothing spline.
Methods
The code pasted below does this with the ctd dataset in the oce package. The
function returns the pressure at which the smoothing spline has highest
salinity derivative, and it can also plot the results (which is recommended).
The parameter named deltap is used to set the value of df (degrees of
freedom) for the spline. One might think of deltap as the thickness (in dbar)
of the smoothing interval for each of the sub-components of the spline.
library(oce)
findHalocline <- function(ctd, deltap = 5, plot = TRUE) {
    S <- ctd[["salinity"]]
    p <- ctd[["pressure"]]
    n <- length(p)
    ## trim df to be no larger than n/2 and no smaller than 3.
    N <- deltap / median(diff(p))
    df <- min(n / 2, max(3, n / N))
    spline <- smooth.spline(S ~ p, df = df)
    SS <- predict(spline, p)
    dSSdp <- predict(spline, p, deriv = 1)
    H <- p[which.max(dSSdp$y)]
    if (plot) {
        par(mar = c(3, 3, 1, 1), mgp = c(2, 0.7, 0))
        plotProfile(ctd, xtype = "salinity")
        lines(SS$y, SS$x, col = "red")
        abline(h = H, col = "blue")
        mtext(sprintf("%.2f m", H), side = 4, at = H, cex = 3 / 4, col = "blue")
        mtext(sprintf(" deltap: %.0f, N: %.0f, df: %.0f", deltap, N, df),
            side = 1, line = -1, adj = 0, cex = 3 / 4
        )
    }
    H
}
# Plot two panels to see influence of deltap.
par(mfrow = c(1, 2))
data(ctd)
findHalocline(ctd)
findHalocline(ctd, 1)
Results
The graph shows results for a test dataset provided with the oce package, using
two values for deltap.
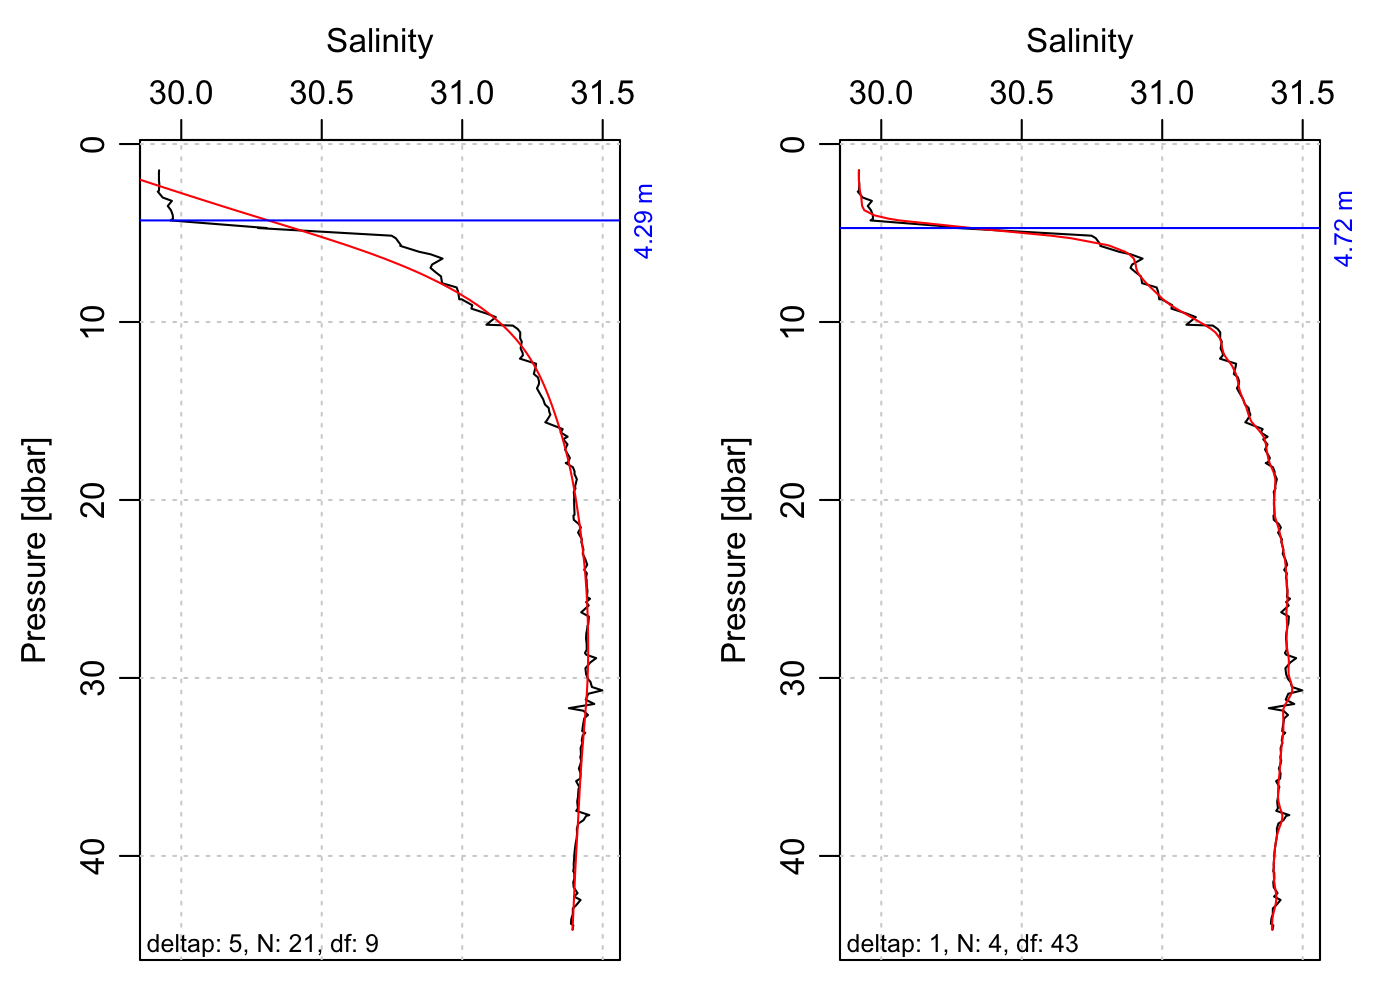
Discussion
Lacking further information about the data or a statistical model of the
variation, the choice of deltap is somewhat open, and one interpretation of
the results would be to state that the halocline depth is likely to be between
4 and 5 m.