Sundial calculations
After experimenting with calculations for what I eventually came to realize were analemma-based sundials (with shadow cast by a vertical pole), I remembered that the common sundial has a wedge as the shadow-maker. A bit of research told me that the wedge is called a gnomon. It is a right triangle with one vertex (the centre vertex, shall we say) having angle equal to the local latitude. If this wedge is placed upright on a horizontal plane with the centre vertex aligned south and the 90deg vertex aligned north, then the shadow will produce a line that indicates the hour of the day. This works throughout the year, with approximately quarter-hour adjustments being required through the seasons.
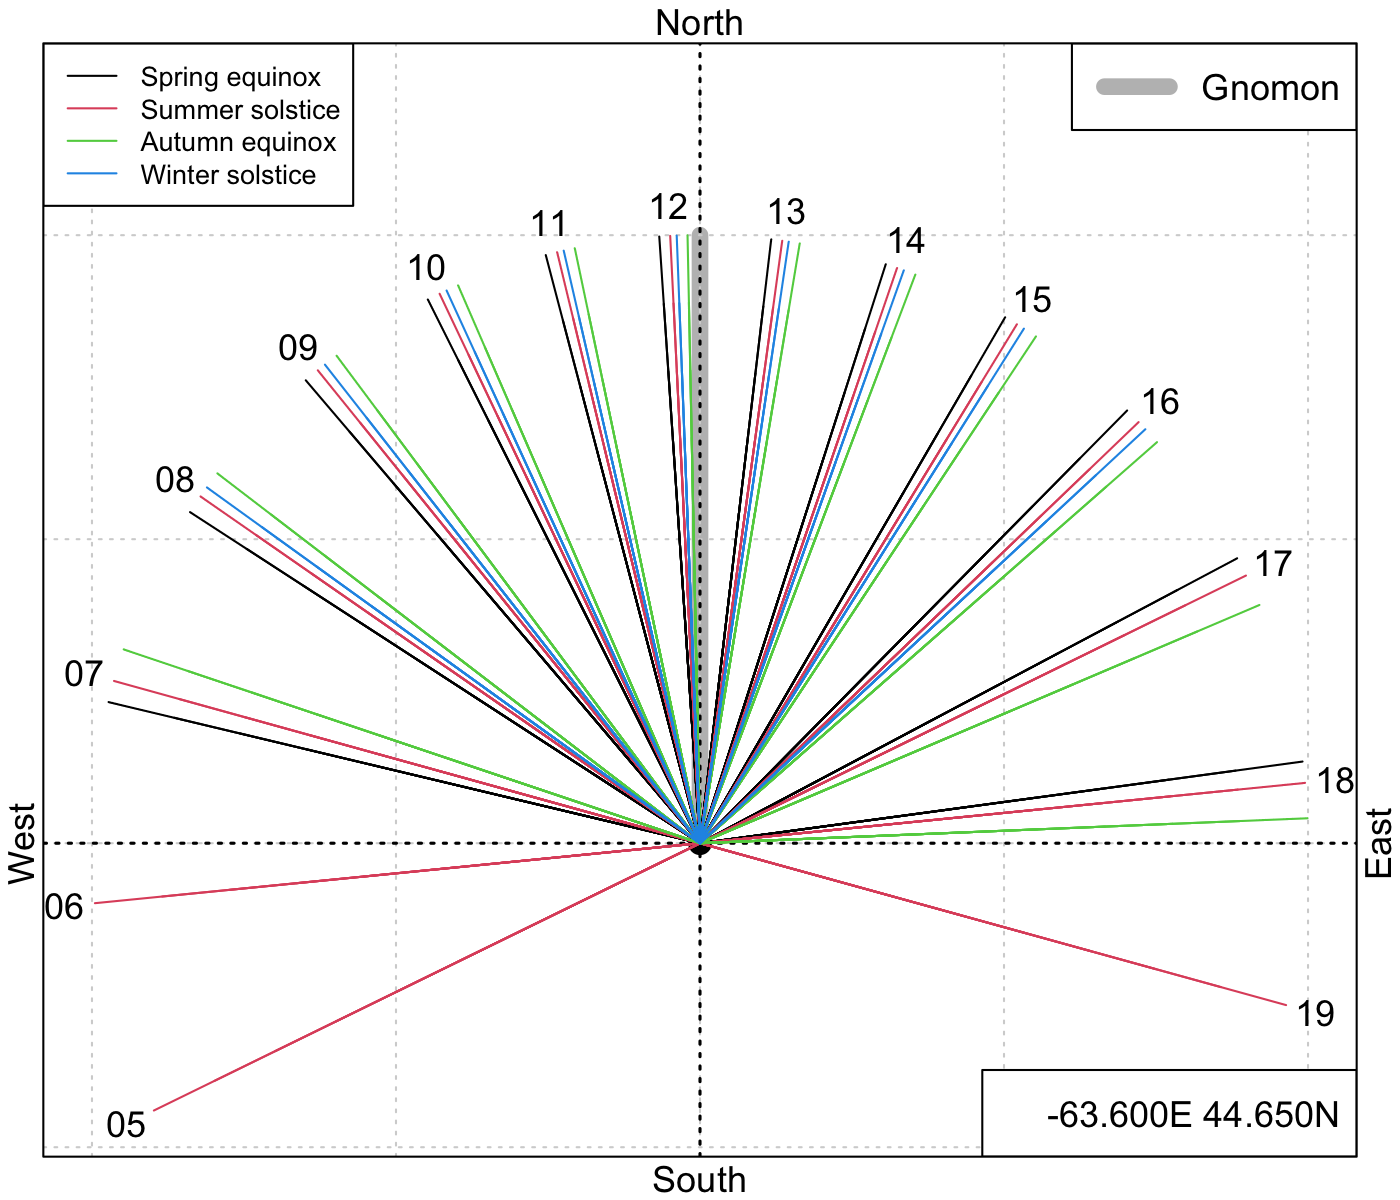
The R code given below the diagram creates an outline of the expected edge of the shadow of the gnomon. To illustrate the variation in angle through the year (which relates to the so-called equation of time), colours are used to indicate four significant times during the year.
Printed at full scale, the diagram might be suitable for laying out the horizontal scale for a sundial. Naturally, readers must alter the latitude and longitude if they do not live in Halifax, Nova Scotia.
A few notes:
- The gnomon hypotenuse will point to the pole star (Polaris) when the apparatus is aligned properly towards the north.
- Calling the function with
debug=1will show dots along the radial lines. These are the shadows of virtual points lying along the hypotenuse of the gnomon, and provide a check against errors in the calculation (since they should lie along a line if the gnomon angle matches the latitude). - Noon is not aligned with North because the longitude is not an even multiple of 15 degrees.
- The length of the shadow provides extra information, but here this information is not shown, since the code normalizes these quantities.
library(oce)
sundial <- function(
    lon = -63.60, lat = 44.65,
    days = c("2014-03-20", "2014-06-20", "2014-09-23", "2014-12-21"),
    keys = c(
        "Spring equinox", "Summer solstice",
        "Autumn equinox", "Winter solstice"
    ),
    debug = 0) {
    col <- 1:4
    glwd <- 8
    timezone <- floor(0.5 + lon / 15)
    L <- 1 # horiz gnomon length (arbitrary)
    nhours <- 24
    first <- TRUE
    for (season in 1:4) {
        hours <- seq.POSIXt(as.POSIXct(days[season], tz = "UTC"),
            by = "1 hour", length.out = nhours
        )
        for (hour in seq_along(hours)) {
            t <- hours[hour]
            tlocal <- t + 3600 * timezone
            sa <- sunAngle(t, lon = lon, lat = lat)
            gy <- seq(0, L, length.out = 10)
            gx <- rep(0, length(gy))
            gz <- gy * tan(lat * pi / 180)
            R <- gz / tan(-sa$altitude * pi / 180) # radius of shadow
            theta <- (90 - sa$azimuth) * pi / 180
            par(mar = rep(2, 4))
            x <- gx + R * cos(theta)
            y <- gy + R * sin(theta)
            len <- max(sqrt(x^2 + y^2))
            x <- x / len * L
            y <- y / len * L
            if (sa$altitude > 0) {
                if (first) {
                    first <- FALSE
                    D <- L * 5
                    plot(x, y,
                        type = "n", pch = 20, asp = 1,
                        xlim = c(-L, L), ylim = c(-L / 5, L),
                        axes = FALSE, col = col[season], xlab = "", ylab = ""
                    )
                    ## Draw gnomon as a gray bar
                    segments(0, 0, 0, L, lwd = glwd, col = "gray")
                    grid()
                    abline(h = 0, lwd = 1.5 * par("lwd"), lty = "dotted")
                    abline(v = 0, lwd = 1.5 * par("lwd"), lty = "dotted")
                    mtext("South", side = 1, at = 0)
                    mtext("West", side = 2, at = 0)
                    mtext("North", side = 3, at = 0)
                    mtext("East", side = 4, at = 0)
                    legend("topright",
                        lwd = glwd, col = "gray",
                        legend = "Gnomon"
                    )
                    legend("bottomright",
                        legend = sprintf("%.3fE %.3fN", lon, lat)
                    )
                    legend("topleft",
                        lwd = 1, col = 1:4, cex = 3 / 4,
                        legend = keys
                    )
                    box()
                    points(0, 0, pch = 20, cex = 2)
                    segments(0, 0, x, y, col = col[season])
                } else {
                    segments(0, 0, x, y, col = col[season])
                    if (debug) {
                        points(x, y)
                    }
                }
                if (season == 2) {
                    xend <- tail(x, 1)
                    yend <- tail(y, 1)
                    text(1.05 * xend, 1.05 * yend, format(tlocal, "%H"))
                }
            }
        }
    }
}
sundial()