Day length calculation
The winter solstice has been on many minds lately. The days are about to start getting longer … but just how fast will they do that?
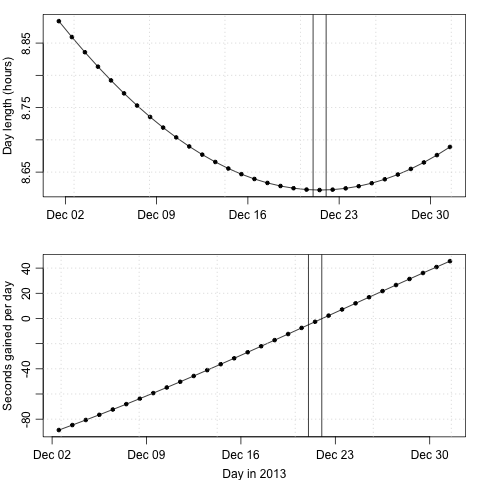
This post provides R code that calculates and graphs day length and its
variation, using uniroot() to find sunrises and sunsets as indicated by solar
altitude, as computed with the oce function sunAngle().
The day of the solstice is indicated with vertical lines. All times are in UTC,
which is the conventional system for scientific work and the one required by
sunAngle().
The first step in making the graph shown below is to load the oce library
and create a function that measures day length by finding sunrise and sunset
times. Note that uniroot(), which is used to find times of zero solar
altitude, needs lower and upper limits on t, and these are calculated by
looking back and then forward a half-day. This works well for application to
Halifax, but in other timezones other offsets would be needed. Interested
readers might want to devise a method based on the longitude, which can be
transformed into a timezone.
Code
library(oce)
if (!interactive()) png("2013-12-21-day-length.png")
daylength <- function(t, lon = -63.60, lat = 44.65) {
    t <- as.numeric(t)
    alt <- function(t) {
        sunAngle(t, longitude = lon, latitude = lat)$altitude
    }
    rise <- uniroot(alt, lower = t - 86400 / 2, upper = t)$root
    set <- uniroot(alt, lower = t, upper = t + 86400 / 2)$root
    set - rise
}
# Compute day length for December, 2013.
t0 <- as.POSIXct("2013-12-01 12:00:00", tz = "UTC")
t <- seq.POSIXt(t0, by = "1 day", length.out = 1 * 31)
dayLength <- unlist(lapply(t, daylength))
# Set up to plot two panels, with narrowed margins.
par(mfrow = c(2, 1), mar = c(3, 3, 1, 1), mgp = c(2, 0.7, 0))
# daylength in the top panel
plot(t, dayLength / 3600,
    type = "o", pch = 20,
    xlab = "", ylab = "Day length (hours)"
)
grid()
solstice <- as.POSIXct("2013-12-21", tz = "UTC")
abline(v = solstice + c(0, 86400))
# daylenfth difference in bottom panel
plot(t[-1], diff(dayLength),
    type = "o", pch = 20,
    xlab = "Day in 2013", ylab = "Seconds gained per day"
)
grid()
abline(v = solstice + c(0, 86400))