Introduction
The default swN2() calculation in Oce uses a smoothing spline. One disadvantage of this is that few readers will know how it works. A possible alternative is to compute d(rho)/dz using the slope inferred from a running-window linear regression. Such a slope is provided by the new Oce function runlm(), which is tested here. (Note that runlm() is new enough that its argument list may change as a result of tests like the present one.)
Methods
1
library(oce)
## Loading required package: methods
## Loading required package: mapproj
## Loading required package: maps
1
2
3
4
5
6
7
8
9
10
11
data(ctd)
rho <- swRho(ctd)
z <- swZ(ctd)
drhodz <- runlm(z, rho, deriv = 1)
g <- 9.81
rho0 <- mean(rho, na.rm = TRUE)
N2 <- -g * drhodz/rho0
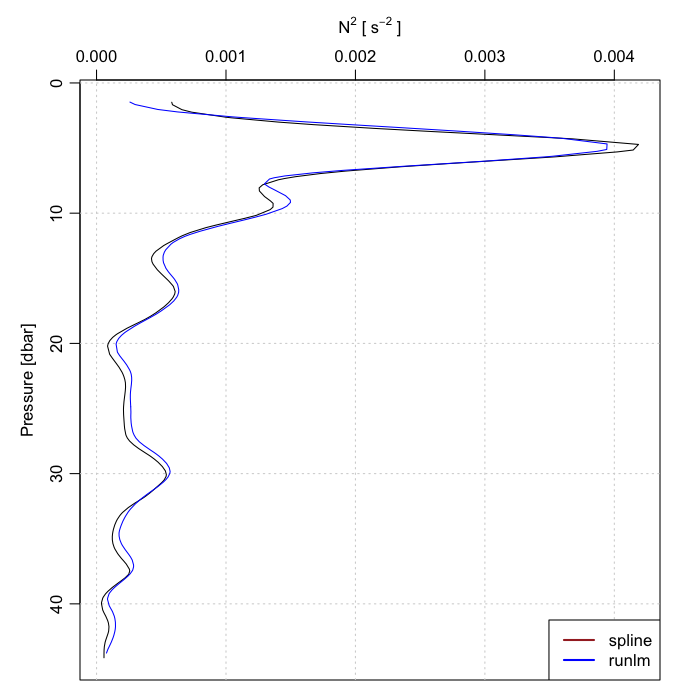
plot(ctd, which = "N2")
lines(N2, -z, col = "blue")
legend("bottomright", lwd = 2, col = c("brown", "blue"), legend = c("spline",
"runlm"), bg = "white")
Results
The reuults look similar but see the question below.
Conclusions
Quantitative measures could be calculated of course, but this first test suggests that the benefits of smooth.spline() may be had with runlm().
Caution. runlm() is still so young that its argument list and action are likely to change at any time. For example, as I was writing this posting I changes the order of the last two arguments, I made the default window="hanning", and I changed the auto-selection of L; these changes seemed more sensible for application to things like N2.
What lengthscale to use?
It may be helpful to determine just how well the two methods can match.
1
2
3
4
5
6
7
N2 <- swN2(ctd)
N2fromderiv <- function(L) {
    -g * runlm(z, rho, L = L, deriv = 1)/rho0
}
best <- optimize(function(L) sqrt(mean((N2 - N2fromderiv(L))^2)), interval = c(1,
    100))
print(best)
## $minimum
## [1] 6.161
##
## $objective
## [1] 7.854e-05
1
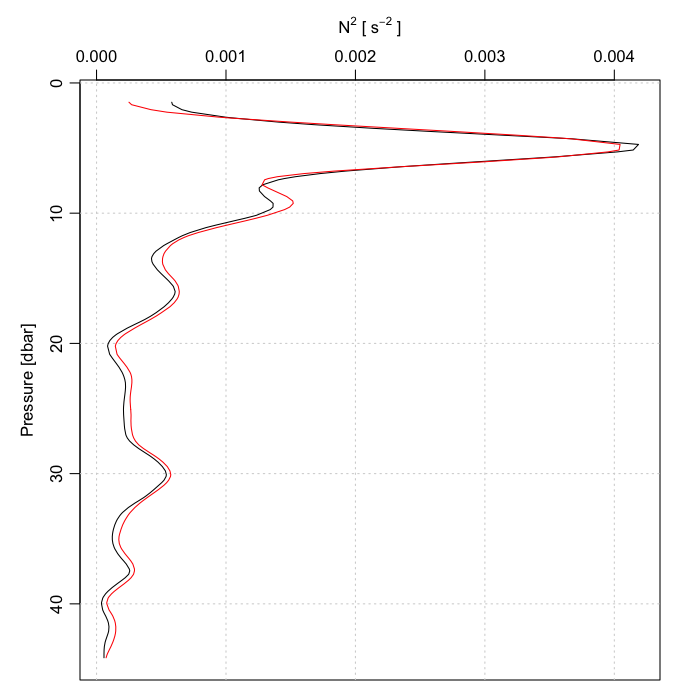
N2best <- N2fromderiv(best$minimum)
This best-matching estimate is the red line.
1
2
plotProfile(ctd, "N2")
lines(N2best, ctd[["pressure"]], col = "red")
Questions
- Why is there a systematic offset in the last figure?
Resources
- Source code: 2014-04-07-N2-runlm.R