Introduction
It is not uncommon to want to digitize values from a graph in a paper, whether to do some initial analysis without bothering an author, or to get data from a paper published so long ago that the data are available only graphically. Although there are several software applications that do this well, it is also possible to use the locator() function of R. This posting shows how to do that.
Method
Code for digitizing a plot on the screen is given below, without comment. It can be saved to a file, for later use. (I don’t bother commenting because the work of doing that is about equal to the work of making a package, which I may do, if anyone expresses interest.)
1
2
3
4
5
6
7
8
9
10
11
12
13
14
15
16
17
18
19
20
21
22
23
24
25
26
27
28
29
30
31
32
33
34
35
36
37
38
39
40
41
42
43
44
45
46
47
48
49
50
51
52
53
54
55
56
57
58
59
xaxis <- function(values)
{
    n <- length(values)
    message("click on the x axis at places where x=", paste(values, collapse=","), "\n")
    xy <- locator(n)
    m <- lm(values ~ xy$x)
    C <- as.numeric(coef(m))
    xa <<- C[1]
    xb <<- C[2]
}
yaxis <- function(values)
{
    n <- length(values)
    message("click on the y axis at places where x=", paste(values, collapse=","), "\n")
    xy <- locator(n)
    m <- lm(values ~ xy$y)
    C <- as.numeric(coef(m))
    ya <<- C[1]
    yb <<- C[2]
}
topright <- function()
{
    message("click the top-right corner of plot box\n")
    xy <- locator(1)
    xout <<- xy$x
    yout <<- xy$y
}
data <- function(n=100)
{
    message("escape by clicking to right of or above top-right corner of box\n")
    x <- y <- NULL
    i <- 1
    while (TRUE) {
        xy <- locator(1)
        xx <- xa + xb * xy$x
        yy <- ya + yb * xy$y
        cat("i=", i, "xy:", xy$x, xy$y, "->", xx, yy, "\n")
        if (xy$x > xout || xy$y > yout) {
            return(list(x=x, y=y))
        }
        x <- c(x, xx)
        y <- c(y, yy)
        i <- i + 1
        if (i > n)
            return(list(x=x, y=y))
    }
}
digitize <- function(image, xaxis, yaxis)
{
    library(png)
    png <- readPNG(image)
    par(mar=rep(0, 4))
    plot(0:1, 0:1, type='n')
    rasterImage(png[,,1], 0, 0, 1, 1)
    xaxis(xaxis)
    yaxis(yaxis)
    topright()
    data()
}
Application
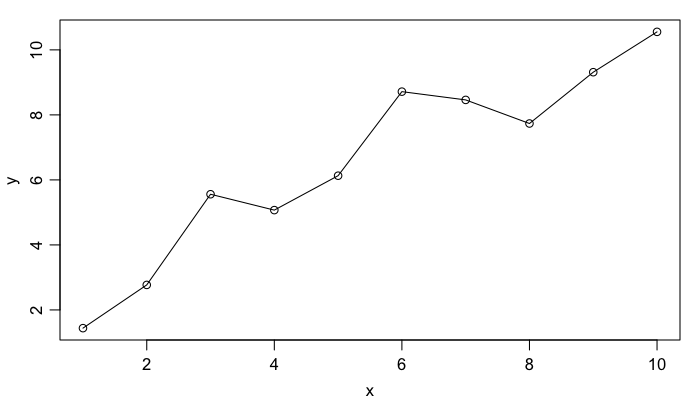
As a test of this, let’s create some fake data
1
2
3
4
5
set.seed(123)
x <- 1:10
y <- 1 + x + rnorm(10)
par(mar=c(3, 3, 1, 1), mgp=c(2, 0.7, 0))
plot(x, y, type='o')

and digitize the resultant image (saved in a PNG file).
1
xy <- digitize("sample.png", c(2, 10), c(2, 10))
Results
When I did as above, clicking points without a great deal of care, I got an RMS error of a bit under 2 percent. It seems likely that more careful work could get this closer to 1 percent.
Conclusions
This method is perhaps slightly easier than hand-rolling new code for each instance of this task. It lacks some basic features, however. One nice addition would be the ability to remove data points. For that, perhaps the lower-left corner of the graph box could be determined with a function named bottomleft(), and the rule could be that clicking below that point or to its left would remove the most recent point. That’s an exercise for the reader. Possibly the next step would be to take the hour it would take to create a little package … although it seems likely that one already exists!
Resources
- Source code: 2014-03-12-digitizing-plots.R