Abstract R code is provided in aide of laboratory demonstration of cabelling.
Introduction
Setting up a cabelling experiment requires creating two watermasses of equal density, and if only S and T can be measured, that means calculating densities. Using a TS diagram and graphical interpolation is one approach to that task, but another is to use R to do the calculation.
Methods
The code given below will do the calculation for specified Sa, Ta and Sb, where the second letter indicates the watermass. The code uses uniroot() to find the temperature Tb that yields equal densities for watermasses a and b.
1
2
3
4
5
6
7
8
9
10
11
12
13
14
15
16
17
18
19
20
21
22
23
24
25
26
# Alter next three lines as desired; a and b are watermasses.
Sa <- 30
Ta <- 10
Sb <- 40
library(oce)
# Should not need to edit below this line
rho0 <- swRho(Sa, Ta, 0)
Tb <- uniroot(function(T) rho0-swRho(Sb,T,0), lower=0, upper=100)$root
Sc <- (Sa + Sb) /2
Tc <- (Ta + Tb) /2
## density change, and equiv temp change
drho <- swRho(Sc, Tc, 0) - rho0
dT <- drho / rho0 / swAlpha(Sc, Tc, 0)
if (!interactive()) png("cabelling.png", width=7, height=7,
                        unit="in", res=200, pointsize=12)
plotTS(as.ctd(c(Sa, Sb, Sc), c(Ta, Tb, Tc), 0), pch=20, cex=2)
drawIsopycnals(levels=rho0, col="red", cex=0)
segments(Sa, Ta, Sb, Tb, col="blue")
text(Sb, Tb, "b", pos=4)
text(Sa, Ta, "a", pos=4)
text(Sc, Tc, "c", pos=4)
legend("topleft",
       legend=sprintf("Sa=%.1f, Ta=%.1f, Sb=%.1f  ->  Tb=%.1f, drho=%.2f, dT=%.2f",
                      Sa, Ta, Sb, Tb, drho, dT),
       bg="white")
if (!interactive()) dev.off()
If run non-interactively, the code will produce a PNG file like that given below.
Results
The legend summarizes the results, indicating also the density change and the temperature change that would be equivalent to that density change (at the midpoint, c).
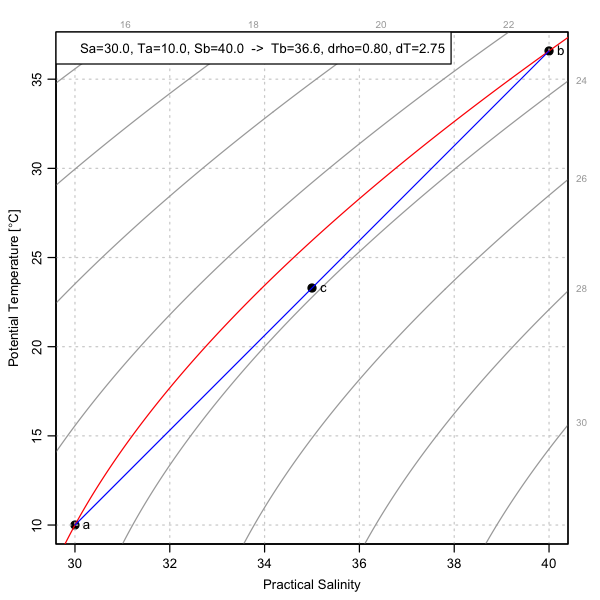
Conclusions
If the design goal is that the density mismatch between watermasses a and b should be, say, 10 percent of the density difference of the mixture watermass (c), then in the illustrated case the temperature would have to be controlled to within a quarter of a degree Celcius – a task that is challenging enough to argue against this as an informal classroom demonstration.
Exercises
- Alter the R code to calculate
Sbin terms ofTb. - Consider (calculate or measure) the convection associated with sidewall heat conduction.