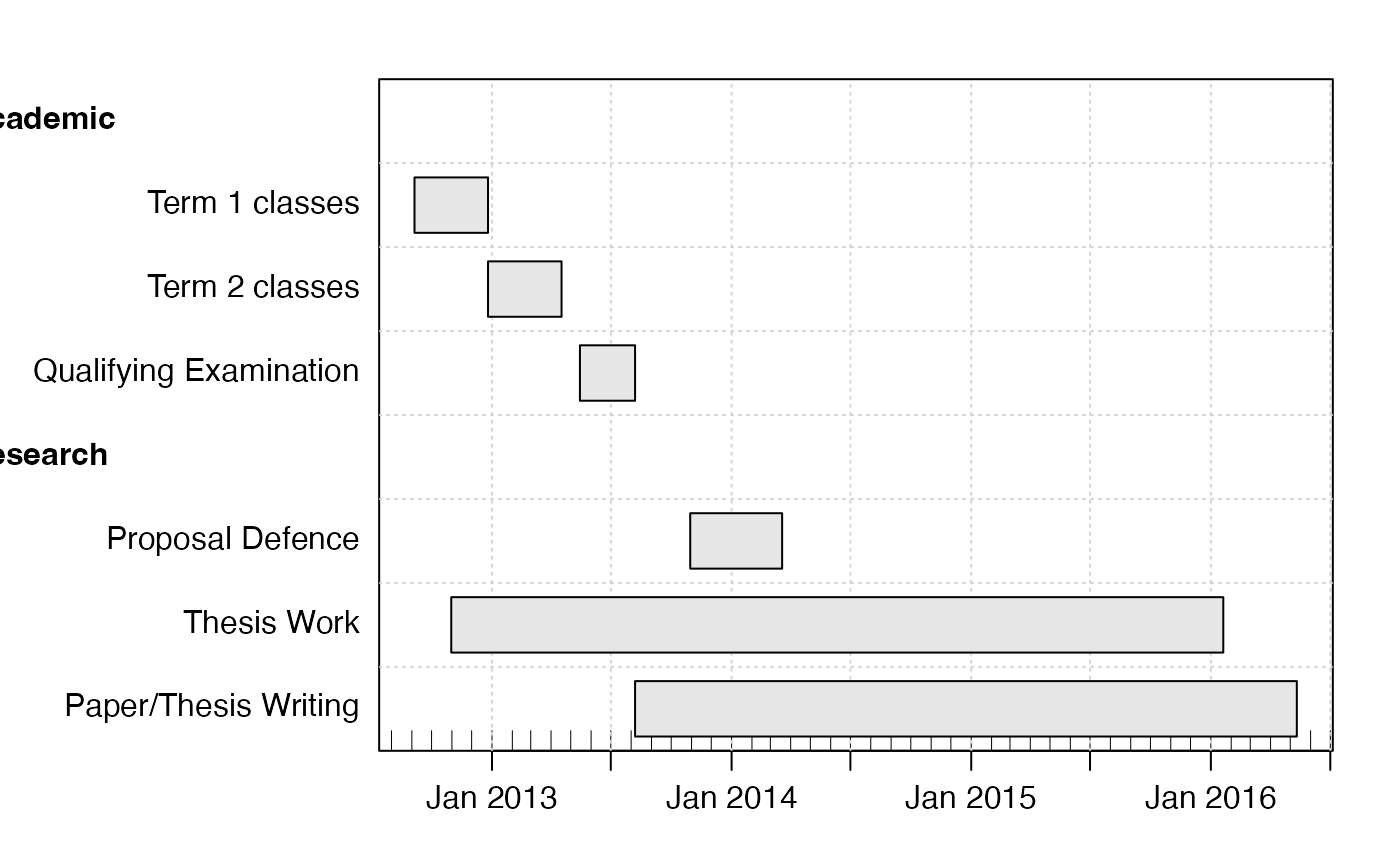
This creates a gantt object.
Arguments
- key
integer key for task, normally 1 for the first task, 2 for the second, etc.
- description
character string describing the task (brief)
- start
start date for task (POSIXt or character string that converts to POSIXt with
as.POSIXct()- end
end date for task (POSIXt or character string that converts to POSIXt with
as.POSIXct().- done
percentage completion for the task
- neededBy
optional key for a dependent task
Value
A gantt object; for details, see read.gantt().
See also
Other things related to gantt data:
gantt,
gantt-class,
ganttAddTask(),
plot,gantt-method,
read.gantt(),
summary,gantt-method
Examples
library(plan)
arrive <- as.POSIXct("2012-09-05")
month <- 28 * 86400
year <- 12 * month
leave <- arrive + 4 * year
startT1 <- arrive
endT1 <- startT1 + 4 * month
startT2 <- endT1 + 1
endT2 <- startT2 + 4 * month
startQE <- arrive + 9 * month
endQE <- arrive + 12 * month
QEabsoluteEnd <- arrive + 15 * month
startProposal <- arrive + 15 * month # for example
endProposal <- arrive + 20 * month
startThesisWork <- arrive + 2 * month # assumes no thesis work until 2 months in
endThesisWork <- leave - 4 * month
startWriting <- leave - 36 * month
endWriting <- leave
g <- as.gantt(
    key = 1:8, c(
        "Academic",
        "Term 1 classes",
        "Term 2 classes",
        "Qualifying Examination",
        "Research",
        "Proposal Defence",
        "Thesis Work",
        "Paper/Thesis Writing"
    ),
    c(
        startT1, startT1, startT2, startQE, startProposal, startProposal,
        startThesisWork, startWriting
    ),
    c(
        startT1, endT1, endT2, endQE, startProposal, endProposal,
        endThesisWork, endWriting
    ),
    done = rep(0, 7)
)
plot(g,
    xlim = c(arrive, leave),
    ylabel = list(font = c(2, rep(1, 3), 2), justification = c(0, rep(1, 3), 0))
)
